


IN THIS ARTICLE
Key Takeaways
Dashboards aren't disappearing, they're transforming from static, isolated tools into the foundational context layer that AI agents use to understand business logic, navigate data lineage, and deliver explainable insights.
Curated dashboard insights make better AI context than raw data because they're composable (pre-built business logic), mathematically accurate (avoiding errors like averaging an average), and performant (leveraging cached, trusted query patterns).
The future of analytics shifts from passive dashboard viewing to "vibe coded" AI applications that autonomously surface anomalies, identify key drivers, and trigger real business actions, shortening the path from data to decision.
From Dashboards to AI Applications
Many analytics vendors and thought leaders have been proclaiming that "dashboards are dead," suggesting that AI-driven chat and automated insights would render the traditional BI dashboards as obsolete. They aren't entirely wrong in terms of the sentiment. However, the reality is more transformative than the morbid tag line suggests. Dashboards aren't being replaced; they are being supercharged to serve as the foundation for the next generation of decision intelligence.
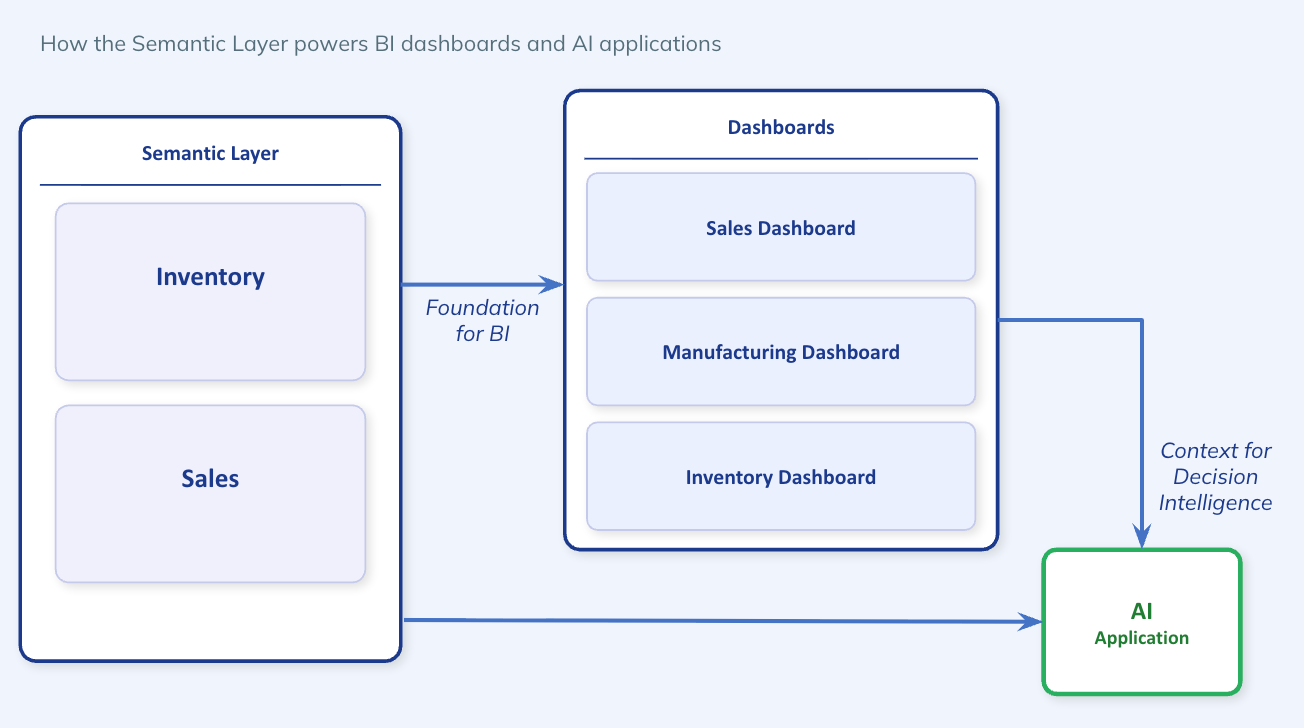
The shift we are seeing moves us away from dashboards as isolated, static tools for interactive analysis toward agentic applications and workflows. In this new era, the dashboard serves as the critical context for AI agents to understand business logic that sits in a layer above the semantic layer, navigate complex data lineage, and deliver explainable insights that can be extended to handle ad-hoc follow up questions, build advanced analytical applications and trigger actionable decision workflows.
Dashboards as context
Every mature organization began its analytics journey with a noble charter; purpose built and curated dashboards, a higher level abstraction to hold business logic for aggregated and cross fact, cross entity analysis which was the basis for charts and visual analysis. The drill down and drill across logic between these insights then served as the blueprint to get to actionable insights. However, these fell short on two counts, the need to switch to another system to take action and the repetitive process of interacting manually to find the proverbial “needle in the haystack”.
Despite these shortcomings, every organization has these golden dashboards that already have the business context codified by domain and functional experts. And, they are already the lifeblood of daily operations, where they are run every single day to make decisions. These dashboard insights serve as query patterns that supplement the semantic layer and all other context that is imputed into AI workspaces for agentic applications.
Why dashboard insights as context?
- Logic is Composable: Instead of feeding AI a flat dataset, we feed it the "recipe"—the curated and governed logical datasets in the semantic layer coupled with all the trusted and verified “institutional context” at the dashboard layer
- Mathematical Accuracy: By using insight query patterns rather than flat tables, agents avoid fatal errors like "averaging an average".
- Native Performance: Analysis stays within the high-efficiency execution engine, leveraging cached insights already being consumed for the daily operational dashboards
The Path Forward: Dashboards to AI Applications
With the latest capabilities of large language models, the future of last mile analytics consumption will be transformed. It will see dashboards serve as a stepping stone to building vibe coded AI applications. The goal of this evolution isn't just to make prettier charts; it's to shorten the cycle from data to action. By embedding agentic insights and workflows into purpose built analytical applications, modern analytical platforms can now autonomously surface anomalies, identify key drivers, and even trigger business actions like sending a PDF report to stakeholders in their team messaging or collaboration platforms of choice. But, through it all, a handful of curated and governed dashboards serve as a key ingredient to an evolving context layer fueling the AI applications.
Dashboards are no longer the end of the analytical journey; they are the starting knowledge base for a more intelligent, conversational, and automated future.
Frequently asked questions
What is a BI dashboard?
A BI dashboard is a visual interface that brings together key metrics, charts, and KPIs from multiple data sources on a single screen. Curated dashboards also capture business logic agreed on by domain experts, such as how metrics are calculated and how to drill from a summary into detail, which makes them a trusted daily reference for decisions.
How is AI changing dashboards?
AI is turning dashboards from static screens into a starting point for conversational and automated analysis. Instead of replacing dashboards, AI agents can use their curated metrics and business logic as context to answer follow-up questions, surface anomalies and key drivers, build analytical apps, and trigger actions, shortening the path from data to decision.
What is drill-down analysis in a dashboard?
Drill-down analysis lets users move from a high-level metric to the detail behind it, such as from total revenue to region, product, customer, and individual transactions. Drill-across lets them compare related metrics across different entities. Together, they help analysts find the cause of a change instead of stopping at the summary number.
The Data Lag Problem: Why Manufacturing Planning, Ops, and Finance Are Always a Step Behind
Manufacturing teams keep running into the same wall: the data that planning, operations, and finance rely on is always a step behind the plant floor. Ebrahim Alareqi, Principal ML Engineer at Incorta, explains why traditional ETL struggles with modern manufacturing, what “real time” should mean for different teams, and how to get AI working on a data foundation you can trust.

Read article
Company
Why Governance Is the New Competitive Moat in Enterprise Analytics
Incorta ranked among the top six vendors for Governance in Gartner®'s 2026 Critical Capabilities. Why governance is now the real competitive moat.

Read article
AI
The Data Underneath Your AI Decides Everything
Getting AI into production depends on the operational data underneath it. Lessons from our Context-Driven AI webinar on building that foundation.
Read article
Data Strategy
Finance’s new mandate: Unlocking the story behind the numbers
Originally posted on CFODive.com. AI is making it easier for finance to connect the dots, but better forecasting still depends on people who understand the business, tech executive Mike Nader writes.

Read article
Platform
SAP ECC End of Support 2027: What It Means and What to Do Next
SAP ECC support is ending. What it means for your business and your data, plus the steps to take now.
Read article
Company
Incorta Earns 15 G2 Badges in the Fall 2026 Reports
Incorta earned 15 G2 badges in Fall 2026, including Easiest Setup, Easiest Admin and Easiest To Use in Enterprise Data Preparation.
Read article
Data Strategy
Move From Reporting on the Past to Acting in the Present
Incorta and Google Cloud turn systems of record into a foundation for analytics, Gemini and AI workflows that support real-time decisions.
Read article
Data Strategy
AI Can Access Your Data. But Can It Understand Your Business?
Enterprise data carries the relationships and business logic that make a company run. Learn why AI needs that context preserved from ERP to BigQuery, not just access to raw tables.
Read article
Data Strategy
Replicated Data ≠ AI-Ready Data
Copying data isn't enough for AI. Incorta and Google Cloud preserve the relationships, rules and context that make enterprise data AI-ready.
Read article
Industries
Why Finance Can't Quit Excel, and What It's Costing You
Over half of finance leaders in our poll still rely on Excel. Why the habit persists, and what it's quietly costing every team that depends on it.
Read article
Industries
Finance Doesn't Trust Its Data. AI Makes It Worse.
One in five finance leaders say untrustworthy data is their biggest challenge. Here's why trust breaks down, why AI exposes a weak data foundation, and what trustworthy data really requires.
Read article
Platform
Adaptive Data Foundation: Live Data for Finance Teams
Finance teams plan with data that's already out of date. How the Adaptive Data Foundation, powered by Incorta, closes that gap in Workday Adaptive.
Read article
Industries
Incorta + Workday Adaptive Planning
By the time finance sees a variance, it's often too late to act. Incorta and Workday on why closing that gap takes a governed data foundation.
Read article
Platform
Incorta Builder: Close the Gap Between Insight and Action
Dashboards show what happened, but users still export to Excel to act on it. Meet Incorta Builder and the Smart Agent, built to close the gap between insight and action on governed data.
Read article
AI
MCP, Context Engineering, and the Foundation of Agent-Driven Software
What Model Context Protocol means for how AI systems get built, and why the data and analytics layer sits at the center of agent-driven software.
Read article
Company
Incorta's Take on the 2026 Gartner® Magic Quadrant™ for BI
Incorta is a Niche Player for the fifth year in the 2026 Gartner® Magic Quadrant™. Our take on agentic insights, semantic modeling and conversational BI.
Read article
Platform
Build AI Apps on Live Enterprise Data with Incorta Builder
Teams are describing apps in plain language and getting something working the same week. See what Incorta Builder makes possible when AI apps run on live, governed enterprise data.
Read article
Platform
Closing the Loop: Write Decisions Back to Your Systems
A decision isn't done until it reaches your source systems. Orchestrate Workflows writes approved plans and forecasts from Incorta back where they belong.
Read article
AI
Dashboards Aren't Dead: They're Your AI's Context Layer
Dashboards aren't dying, they're evolving. The business logic inside them is becoming the context layer that powers AI apps and agentic workflows.

Read article
AI
Meet your new go-to AI Data Analyst: Claude
Claude has moved past summarizing data. Learn how it executes code, queries live systems, and works inside your existing stack as a fully functional AI data analyst.
Read article
AI
From Dashboards to Decisions: The Era of Agentic Analytics
Google Cloud Next 2026 showed agentic AI moving past static dashboards. The edge now goes to companies with a real-time, governed data foundation.
Read article
Platform
Incorta and Google Team Up to Solve Enterprise AI's Biggest Problem
Enterprise AI stalls on incomplete, outdated or locked-away data. Why Incorta and Google Cloud partnered to solve exactly that problem.
Read article
AI
Agentic AI on Your ERP Data with Incorta + Gemini Enterprise
Gemini Enterprise agents are only as good as the ERP data behind them. How Incorta delivers live, business-ready Oracle, SAP and Workday data to BigQuery.
Read article
AI
Intelligent AP Agent: Accounts Payable Goes Agentic
Incorta's Intelligent AP Agent validates invoices against contracts, flags pricing discrepancies and acts on its own. Agentic finance starts here.
Read article
Data Strategy
Before You Build Another ERP Pipeline, Read This
Custom ERP data pipelines often take 18 to 24 months and eat most of your data team's time. Learn why building from scratch stalls enterprise AI and how to get AI-ready ERP data in weeks.
Read article
Platform
Oracle BI Tools: How They Work and When to Use Them
A practical overview of Oracle BI tools: what they are, how they work and where they fall short. Plus how finance and operations teams get faster, more granular answers with less IT dependency.
Read article
Platform
OBIEE Reporting: How It Works, What It Does, and How to Get Started
Learn how OBIEE reporting works and how to get started, including the semantic layers and aggregation tables it depends on, and how to report on live, detailed source data instead.
Read article
Platform
OBIEE vs. Other BI Tools: What's the Difference?
How does OBIEE compare with other BI tools? We break down the key differences and show how analysts can query granular source data directly, without ETL pipelines or pre-aggregated models.
Read article
Platform
What Is OBIEE? Definition, Meaning, and Overview
What is OBIEE? A clear introduction to Oracle Business Intelligence Enterprise Edition, who uses it, its common limitations, and how Oracle users work with live, detailed data today.
Read article
Foundations
What is unified data analytics?
Unified data analytics is the practice of bringing together data from all of an organization's enterprise systems into a single, analysis-ready environment — eliminating silos and giving teams a complete, consistent picture of the business.
Read article
Foundations
What is an AI data platform?
An AI data platform provides the data infrastructure needed to build, run, and scale AI and machine learning applications — combining data integration, storage, governance, and AI tooling in a unified environment.
Read article
Foundations
What is ETL?
ETL (Extract, Transform, Load) is the process of pulling data from source systems, transforming it into an analysis-ready format, and loading it into a data warehouse or analytics platform.
Read article
Foundations
What is a semantic layer?
A semantic layer translates complex database structures into plain business terms — giving analysts and business users a consistent, governed way to query data without needing to know SQL or table schemas.
Read article
Foundations
What is agentic AI?
Agentic AI refers to AI systems that can autonomously plan, reason, and take multi-step actions to complete a goal — going beyond answering questions to actually executing tasks on behalf of users.
Read article
Foundations
What is decision intelligence?
Decision intelligence is the discipline of turning data into better business decisions — combining analytics, AI, and contextual business logic to help organizations act faster and more confidently.
Read article
Data Strategy
AI Won't Fix a Weak Data Foundation
Boards want AI results, but AI can't make up for fragmented, stale data. Why a strong data foundation has to come first, and how Incorta is approaching AI apps and agentic workflows.
Read article
AI
Episode 4: Your AI Agent Is Only as Safe as the Data Behind It
Episode 4 of Innovate with Intelligence: AI agents create a new security category. Learn why securing the data comes first, and how the semantic layer and auditing keep enterprise agents safe.
Read article
AI
Ep. 3: A Framework for Enterprise AI Evaluation
Episode 3 of Innovate with Intelligence: vibes don't scale. Build a golden dataset, measure the signals that matter and automate scoring with an LLM as judge to evaluate enterprise AI.
Read article
AI
Ep. 2: 4 Design Patterns for Production-Ready AI Agents
Episode 2 of Innovate with Intelligence: prompt chaining, routing, parallelization and tool use are the design patterns that turn an AI demo into a production-ready enterprise agent.
Read article
AI
Ep. 1: 2 Design Patterns Every AI Agent Needs
Episode 1 of Innovate with Intelligence: human in the loop and agent-to-agent communication are the two design patterns every enterprise AI agent needs, and most don't have.
Read article
Industries
Gartner® on Supply Chain Visibility to Orchestration
Gartner® maps the path from supply chain visibility to guided actions and autonomous orchestration. What it means for supply chain leaders.
Read article
Industries
What Causes Stockouts? How to Predict and Prevent Inventory Shortages
Stockouts cost lost sales, expedited freight and customer trust. Learn the demand-side and supply-side causes of inventory shortages and how to predict and prevent them before they hit.
Read article
Industries
What Is Safety Stock? How to Calculate and Optimize Buffer Inventory
Safety stock protects against demand swings and supply delays, but outdated formulas tie up millions in excess inventory. Learn how to calculate safety stock and optimize it with live data.
Read article
Industries
What Is SLOB Inventory? How to Find and Reduce It
SLOB inventory typically makes up 20-25% of total stock and costs companies millions annually. Here's how to spot it early and stop the bleed.
Read article
Industries
Factory Floor Success: From Weeks to Clicks | Incorta
3 manufacturing & supply chain leaders share how they turned data chaos into confident decisions.
Read article
Data Strategy
The AI Paradox: Why Your Data Foundation Is the Real Innovation
Every board wants AI, but success can't be conjured from an unstable data foundation. Explore what blocks data readiness and the three pillars of an AI-ready data foundation.
Read article
AI
AI Reality Check From a Former Meta AI Marketer (Our CMO)
Our CMO Noha Rizk on why legacy dashboards and delayed data hold businesses back, and what it takes to deliver real-time insights and AI actions.
Read article
Data Strategy
Your ERP Data Pipeline is Killing Your AI Strategy
Custom ERP data pipelines fail 55-75% of the time. See why building from scratch kills AI timelines and what data leaders should do instead.
Read article
AI
From Data Chaos to AI-Ready with Gemini
Getting ERP data into BigQuery for Gemini Enterprise doesn't have to be a year-long engineering project. Here's the faster path.
Read article
AI
How HP and Al Rajhi Bank Achieved AI ROI
At NoLimits Riyadh, we brought together four visionary leaders to discuss one of the most pressing questions facing organizations today: How do you turn AI investments into real business impact?
Read article
Company
Incorta Launches AI Upskilling Initiative in Saudi Arabia
Incorta and Saudi Arabia's MCIT launched a national program to certify 100,000 Saudis in AI and data skills, supporting Vision 2030.
Read article
Platform
Incorta Workday Integration for Finance Teams
At Workday Rising 2025, Incorta showed an integration that ends finance's endless cycle of manual reconciliation and variance investigation.
Read article
Data Strategy
Decision Intelligence: Rethinking Your Data Strategy
The enterprise data landscape has just shifted, and most organizations are not yet aware of it. What is decision intelligence?
Read article
Data Strategy
Medallion Architecture with Incorta Explained
The Medallion architecture organizes data into Bronze, Silver and Gold layers. Here's how Incorta fits into each one and speeds up the path to insight.
Read article
Data Strategy
Decision Intelligence and the AI-Driven Future
Incorta's vision for decision intelligence: the next step beyond traditional analytics, built on real-time, contextual data for AI-driven decisions.
Read article
AI
Why 95% of AI Projects Fail.
An MIT study found 95% of enterprise GenAI pilots fail to deliver impact. The problem isn't the model. It's the data foundation underneath it.
Read article
Industries
Solving CFO Data Visibility Challenges
Even our own CFO uses Incorta to solve his data visibility problems. See how.
Read article
Platform
Incorta Data Apps for Workday: Faster Data Extraction
Understand how to use Incorta's Data Apps for Workday: using our pre-built data products to deploy faster analytics while maintaining high-fidelity data.

Read article
Customers
Real-Time Financial Intelligence from SAP
From 4-week forecasts to 4-hour cycles: How this plant-based ingredients manufacturer saved $1M annually while achieving 99.7% costing accuracy
Read article
Company
No Limits Riyadh: Shaping the Future of Data
From $1M compliance savings to 56% faster fraud detection, NoLimits brings you real-world data breakthroughs - join global leaders turning raw data into real impact this year on September 4th.
Read article
AI
Demystifying AI Agents
AI agents are one of the hottest topics in tech right now. But what exactly are they? Are they just a repackaging of existing AI concepts, or is there something fundamentally new happening?
Read article
Company
Incorta Named Gartner Niche Player in Analytics & BI
Incorta is a Niche Player for the fourth consecutive year in the 2025 Gartner® Magic Quadrant™ for Analytics and Business Intelligence.
Read article
Data Strategy
ETL Pain? Meet Incorta's Direct Data Mapping®
The hidden bottleneck slowing down your most important decisions - and how to fix it.
Read article
Platform
Incorta Connect for Oracle Cloud ERP & BigQuery
A technical look at how Incorta Connect moves Oracle Cloud ERP data into BigQuery and other cloud warehouses with fast, scalable integration.
Read article
Platform
Introducing Incorta Connect: A Faster Path to Actionable Insights
Your data is stuck in siloed ERP systems and slow ETL pipelines. Meet Incorta Connect, a faster way to deliver detailed ERP data to your cloud data platform for real-time analytics and AI.
Read article
Platform
Oracle to BigQuery: Top Data Challenges
Slow ingestion, restricted access and stale data stall Oracle to BigQuery projects. The top three challenges and how Incorta removes them.
Read article
Data Strategy
Data Platform TCO: The Real Costs and How to Lower Them
The true cost of a data platform goes far beyond licensing. What drives total cost of ownership and how Incorta lowers it.
Read article
Data Strategy
5 Data Access Roadblocks Keeping You From Data Nirvana
More data often means less insight. Explore the five data access roadblocks, from the ETL treadmill to access gatekeepers and siloed systems, and how to clear them for faster decisions.
Read article
Platform
Oracle to Google BigQuery Migration: The Complete Guide
A complete guide to moving Oracle EBS data to BigQuery: the extraction challenges, common roadblocks and how Direct Data Mapping® solves them.
Read article
Platform
How Incorta Fuels AI-Powered Advanced Business Analytics
How Incorta applies AI across data workflows, validation, analysis and ML so teams spend less time on prep and more time on decisions.
Read article
Foundations
What is data analytics in finance and how is it used?
Financial data analytics helps organizations turn raw financial data into actionable insights — improving profitability, cash flow, risk management, and compliance across the enterprise.
Read article
Foundations
What is Oracle Analytics Cloud?
Oracle Analytics Cloud (OAC) is Oracle's fully managed, cloud-native BI platform - and the official successor to OBIEE. Learn what it does, its key limitations, and how Incorta compares.
Read article
Foundations
What is financial planning and analysis (FP&A)?
Financial planning and analysis encompasses several key office of finance activities that collectively help an organization manage its financial strength and business strategy over time.
Read article
Foundations
What is OBIEE?
OBIEE (Oracle Business Intelligence Enterprise Edition) is a business intelligence tool from Oracle Corporation used to gather, store and visualize enterprise data.
Read article
Foundations
What is an analytics platform?
An analytics platform combines data acquisition, storage, preparation, and analysis in a single solution — giving business users self-service access to insights without relying on IT.
Read article
Foundations
What is cloud analytics?
A cloud analytics platform delivers BI and data analytics as a managed cloud service — eliminating on-premises infrastructure costs while scaling to meet growing enterprise data demands.
Read article
Foundations
What is a data analytics platform?
A data analytics platform is a unified solution covering the full analytics lifecycle — from data ingestion and preparation to analysis and visualization — without the complexity of traditional stacks.
Read article
Foundations
What are data connectors?
Data connectors automatically extract and transfer data between systems — enabling faster decisions, real-time analytics, and improved organizational agility. Here's how they work.
Read article
Foundations
What is data mapping?
Data mapping is the process of identifying and linking data fields from source systems to a destination database — the foundation of any analytics, BI, or data integration pipeline.
Read article
Foundations
What is financial analytics?
Financial analytics is the analysis of financial data to assess business viability, profitability, and performance — enabling faster forecasting, better planning, and smarter decision-making.
Read article
Foundations
What is a procurement analytics dashboard?
A procurement analytics dashboard visualizes spend, supplier performance, and purchasing KPIs in one place — helping finance and procurement teams identify cost-saving opportunities and improve cash flow.
Read article
Foundations
What is manufacturing analytics?
Manufacturing analytics can help organizations improve and streamline their manufacturing operations.
Read article
Foundations
What is operational analytics?
Operational analytics is the study of business operations data to identify performance gaps, reduce costs, and improve efficiency — across manufacturing, maintenance, sales, and more.
Read article
Foundations
What is self-service analytics?
Self-service analytics lets business users query data and generate reports independently — without waiting on IT or data engineering teams — enabling faster, more confident decisions.
Read article
Foundations
What is supply chain analytics?
Supply chain analytics combines data from procurement, inventory, warehousing, and fulfillment into a single view — helping organizations reduce costs, avoid stockouts, and optimize operations.
Read article
Industries
The Manufacturing Revolution is Here: Are You Ready?
The manufacturing industry has always been driven by efficiency, innovation, and process optimization.
Read article
Platform
Seamless Oracle Cloud Data Ingestion with Incorta
Learn how Incorta's Oracle Cloud connectors — BICC, BIP, OTM, WMS, and more — eliminate extraction bottlenecks and accelerate time to analytics by 10x.
Read article
Industries
Tariff hikes on the horizon? How manufacturers can prepare
Inauguration Day next week comes with a sticker shock. The president-elect has promised to implement 25% tariffs on...
Read article
AI
Are you seeing ROI from your GenAI?
GenAI is a business imperative—not just an experiment. Yet many leaders struggle to prove its ROI, stuck in pilot purgatory amid unclear use cases, governance fears, and fragmented data.
Read article
AI
From Data Depth to Agentic Heights: AI for BI
BI platforms are setting the bar high when it comes to harvesting insights from vast amounts of data. But what if business intelligence could go one step further? Enter agentic AI.
Read article
Customers
PAR Systems Sparks Data Curiosity with Incorta
“Incorta has democratized the way we access and use data. It's like we've given each team member their own set of Legos...
Read article
AI
Machine Learning: From Concept to Business Impact
As a branch of AI, machine learning (ML) utilizes algorithms and statistical models to perform specific tasks without explicit...
Read article
Platform
Oracle EBS Analytics with Incorta + Google Cloud Cortex
Access to live data is critical for making informed, agile decisions in any business environment. That’s why we’re excited to...
Read article
Industries
Navigating supply chain disruptions with access to live data
As East and Gulf Coast ports brace for a potential strike, the U.S. faces a significant supply chain disruption.
Read article
Company
The future is bright with Incorta's Summer Intern Program
Meet the next generation of data innovators. See what Incorta's summer interns built — from AI-powered troubleshooting tools to Unity Catalog integrations.
Read article
Platform
‘Extending’ your Workday Extend with Incorta
Workday Rising brought together business leaders and IT professionals from around the globe.
Read article
Platform
Oracle to BigQuery: Decision-Ready Data with Incorta
Oracle Cloud users face fragmented data when moving to BigQuery. Incorta delivers live, analytics-ready data with no-code pipelines and no ETL.
Read article
Data Strategy
From Stale to Strategic: The Edge of Live Operational Data
Stale data costs companies real money. See how access to live, transaction-level operational data helps teams make faster decisions and outpace the competition.
Read article
Customers
How a Manufacturer Cut Reporting Time in Half with Incorta
"With Incorta, we unified data from multiple ERPs in just six months, transforming our financial reporting and analytics capabilities.
Read article