
Safety stock is buffer inventory held to protect against demand variability and supply uncertainty. Most companies set safety stock once per quarter using outdated formulas, resulting in $20-50 million in unnecessary inventory for a typical $500 million supply chain. This guide explains how safety stock works, why traditional approaches fail, and how to optimize buffer inventory for today's volatile supply chains.
What Is Safety Stock?
Safety stock (also called buffer stock or reserve inventory) is extra inventory held beyond expected demand to protect against uncertainty. It serves as insurance against:
- Demand variability: Actual demand exceeding forecasted demand
- Supply variability: Supplier delays, quality issues, or shipment problems
- Lead time variability: Replenishment taking longer than planned
- Forecast errors: Systematic under-prediction of demand
Safety stock sits in addition to cycle stock (inventory needed to meet average demand between replenishments) and pipeline stock (inventory in transit).
Example: If you expect to sell 1,000 units during a 2-week lead time, you might hold 1,000 units of cycle stock plus 200 units of safety stock to cover potential demand spikes or delivery delays.
How Is Safety Stock Calculated?
Traditional safety stock formulas account for demand variability and desired service level:
Basic Safety Stock Formula
Safety Stock = Z × σ × √L
Where:
- Z = Service level factor (e.g., 1.65 for 95% service level)
- σ = Standard deviation of demand
- L = Lead time in the same units as demand measurement
Safety Stock with Lead Time Variability
Safety Stock = Z × √(L × σd² + d² × σL²)
Where:
- σd = Standard deviation of demand
- σL = Standard deviation of lead time
- d = Average demand
How Much Does Excess Safety Stock Cost?
Carrying more safety stock than necessary creates significant costs:
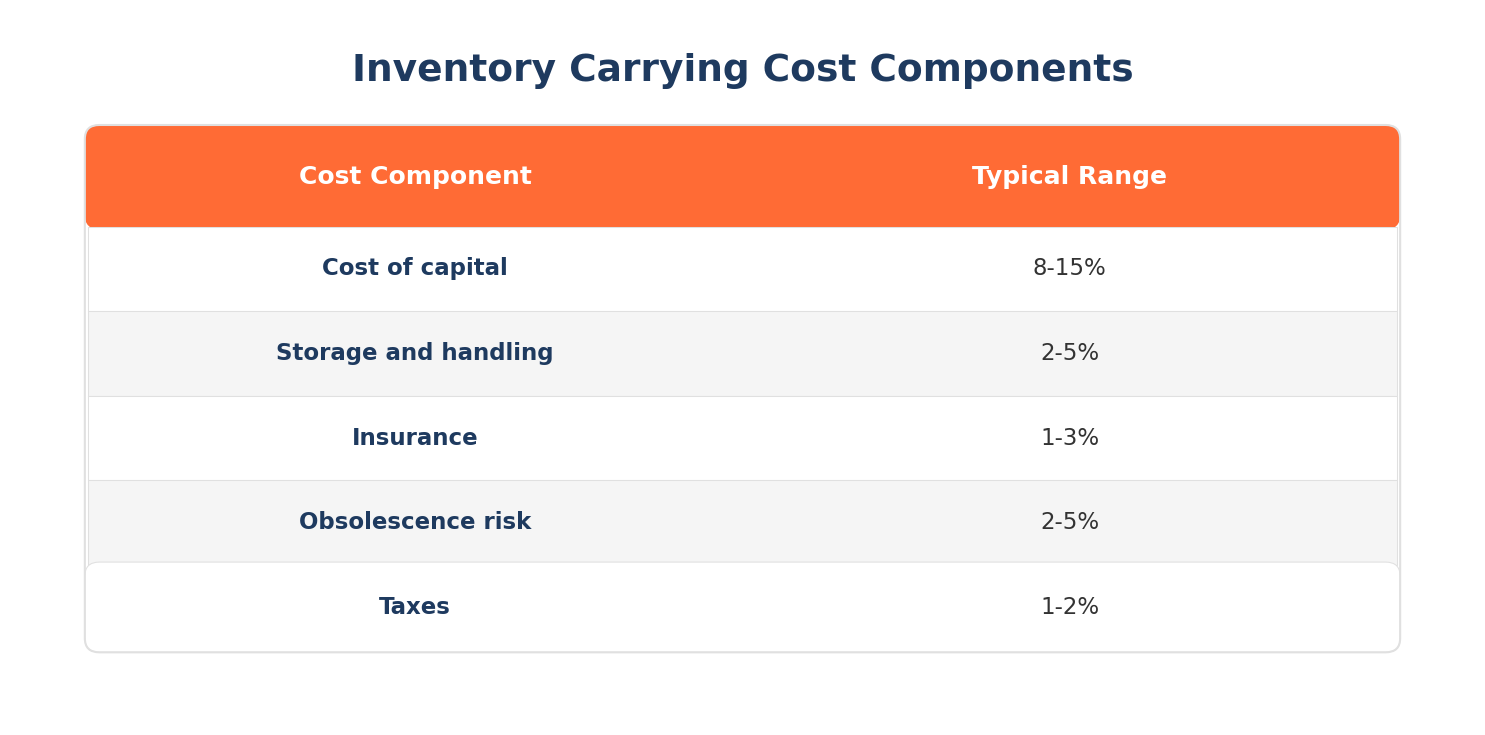
Direct Carrying Costs
Industry estimates put inventory carrying costs at 20-30% of inventory value annually, including:
Opportunity Costs
Capital tied up in excess safety stock cannot be deployed on:
- High-velocity products with better turns
- Growth investments
- Debt reduction
- Shareholder returns
Hidden Costs
- Warehouse space consumed by slow-moving buffer stock
- Working capital pressure on cash conversion cycle
- Complexity in managing larger inventory positions
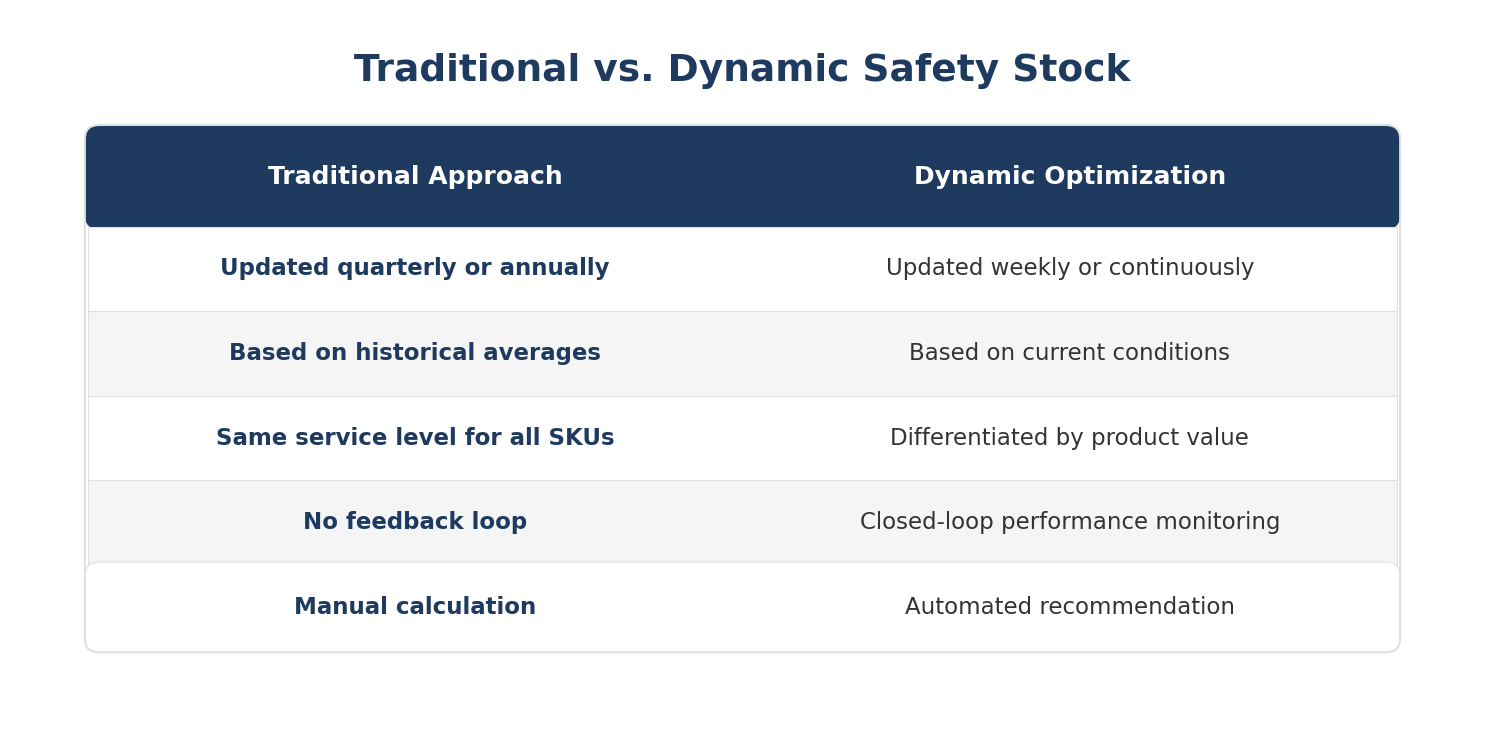
Why Traditional Safety Stock Methods Fail
Most organizations calculate safety stock using formulas that were designed for stable, predictable supply chains. Today's reality is different.
Problem 1: Safety Stock Is Set Too Infrequently
The issue: Most companies review and update safety stock quarterly or annually. But supply chain conditions change weekly.
The impact: A safety stock level set in January based on Q4 data may be completely wrong by March when demand patterns, supplier performance, and lead times have all shifted.
What's needed: Continuous recalibration based on current conditions, not periodic updates based on historical averages.
Problem 2: Formulas Use Stale Inputs
The issue: Safety stock formulas require inputs like demand variability and lead time variability. Most organizations calculate these from historical data that's months or years old.
The impact: If supplier reliability has improved (or degraded) in the past 6 months, your safety stock is calibrated to the wrong reality. If demand patterns have shifted due to market changes, your buffer is sized for a world that no longer exists.
What's needed: Real-time inputs that reflect current demand variability, current supplier performance, and current lead time patterns.
Problem 3: One-Size-Fits-All Service Levels
The issue: Many organizations apply the same service level target (e.g., 95%) across all SKUs, regardless of margin, strategic importance, or customer impact.
The impact: You over-invest in safety stock for low-margin commodities while under-investing for high-margin strategic products. You treat a $5 SKU the same as a $5,000 SKU.
What's needed: Differentiated service levels based on product value, margin, customer importance, and substitutability.
Problem 4: No Visibility into Actual Performance
The issue: After setting safety stock, most organizations don't track whether those levels are actually achieving target service levels.
The impact: You might be carrying $10 million in excess buffer for products that never stockout, while under-buffered products experience chronic availability issues. Without feedback, you can't optimize.
What's needed: Closed-loop monitoring that connects safety stock levels to actual service level outcomes and adjusts accordingly.
What Is Dynamic Safety Stock Optimization?
Dynamic safety stock optimization continuously adjusts buffer levels based on current conditions rather than static historical formulas.
Key Differences from Traditional Approaches
Inputs for Dynamic Safety Stock
Dynamic optimization considers:
Demand signals:
- Current demand velocity vs. historical baseline
- Forecast accuracy for this specific SKU
- Promotional calendar and expected demand lifts
- Seasonality patterns
- Market trends and external signals
Supply signals:
- Current supplier lead time performance
- Supplier reliability scores
- In-transit inventory visibility
- Backup supplier availability
Business context:
- Product margin and strategic importance
- Customer service level requirements
- Substitutability with other SKUs
- Obsolescence risk
- Working capital targets
How to Optimize Safety Stock
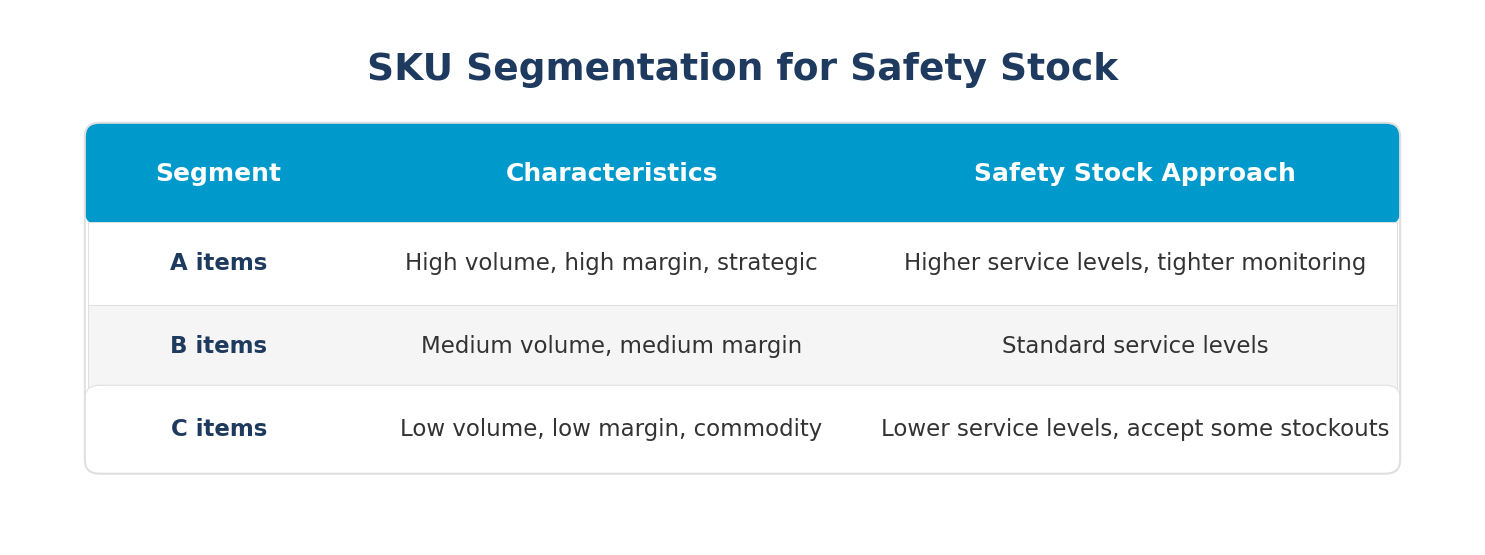
Step 1: Segment Your SKUs
Not all products deserve the same safety stock investment. Segment by:
Step 2: Calculate Current State
Before optimizing, understand your baseline:
- Current safety stock levels by SKU and location
- Actual service levels achieved
- Stockout frequency and root causes
- Carrying costs by segment
Step 3: Identify Optimization Opportunities
Look for:
- SKUs with high safety stock but zero stockouts (potential reduction)
- SKUs with chronic stockouts despite safety stock (needs increase or root cause fix)
- SKUs where demand variability has decreased (formula inputs are stale)
- SKUs where supplier reliability has improved (less buffer needed)
Step 4: Implement Continuous Monitoring
Set up systems to track:
- Actual vs. target service levels by SKU
- Safety stock utilization (how often is buffer actually consumed?)
- Demand variability trends
- Lead time performance trends
Step 5: Automate Adjustments
Move from manual quarterly reviews to automated recommendations:
- System flags when safety stock should be adjusted
- Recommendations include specific suggested levels
- Workflows route approvals to appropriate decision-makers
- Changes flow through to replenishment systems
What Results Can Companies Expect from Safety Stock Optimization?
Organizations that implement dynamic safety stock optimization typically achieve:
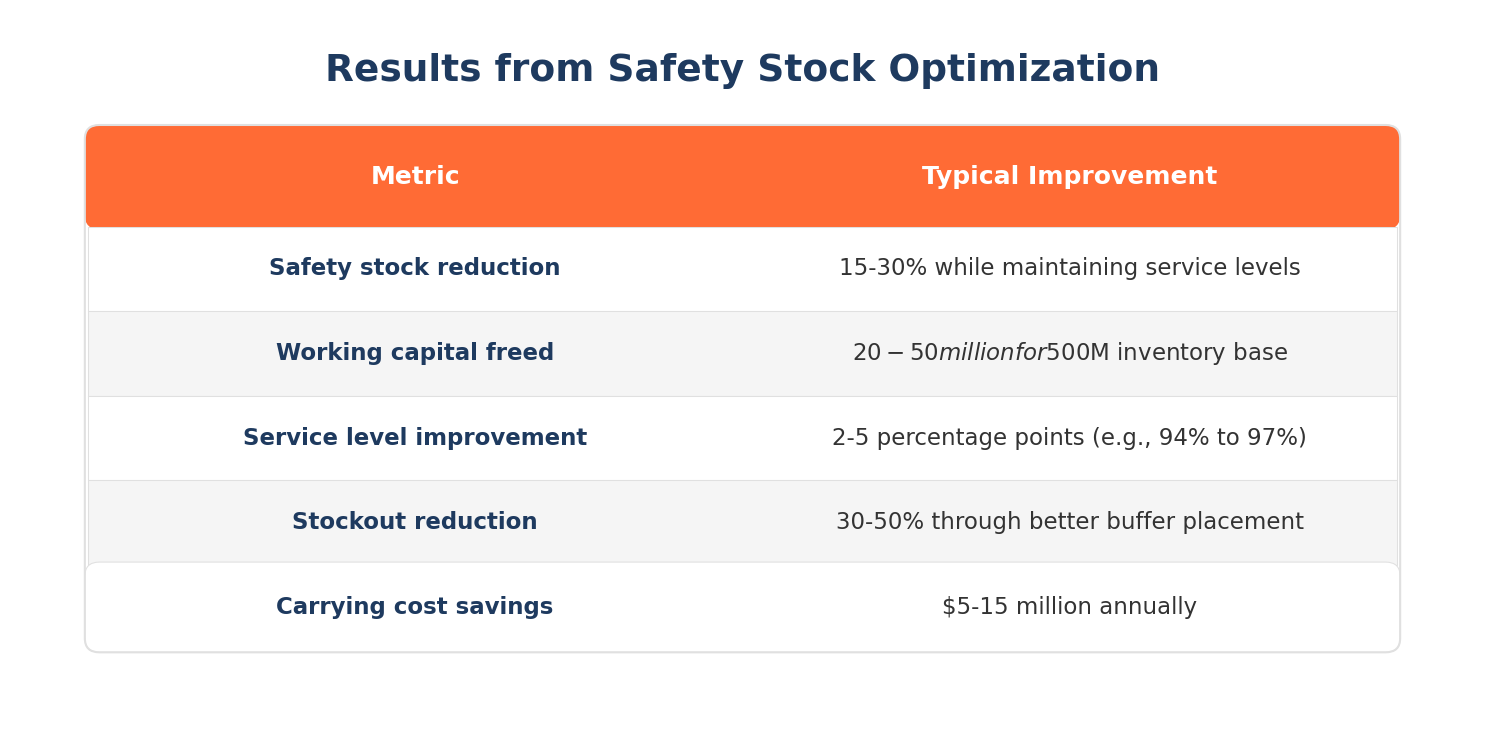
The key insight: most companies can simultaneously reduce safety stock AND improve service levels because current buffers are poorly allocated, not because they need more inventory overall.
Key Takeaways
- Safety stock is buffer inventory held to protect against demand and supply variability
- Traditional safety stock formulas fail because they use stale inputs and are updated too infrequently
- Most companies carry $20-50 million in unnecessary safety stock due to outdated calculations
- Dynamic optimization continuously adjusts buffer levels based on current demand variability, supplier performance, and forecast accuracy
- Companies implementing dynamic safety stock optimization typically reduce inventory 15-30% while improving service levels
How Incorta Helps with Safety Stock Optimization
Incorta gives supply chain teams the real-time visibility and automated workflows needed to move from static safety stock formulas to dynamic optimization.
A live digital twin of your ERP. Incorta's Direct Data Mapping creates a unified, real-time digital twin of your entire ERP and related systems. Every inventory position, every demand signal, every supplier shipment is visible in its original granularity. You see actual current conditions, not historical averages.
Real-time inputs for safety stock calculations. Instead of calculating demand variability from last year's data, Incorta shows you current demand velocity and variability. Instead of assuming supplier lead times match contracts, you see actual performance. Your safety stock inputs reflect reality.
Dynamic recommendations. Incorta adapts safety stock recommendations to current demand variability, supplier reliability, and forecast accuracy. As conditions change, recommendations auto-adjust. You're not locked into quarterly formulas that don't reflect current reality.
Closed-loop performance monitoring. Connect safety stock levels to actual service level outcomes. See which SKUs are over-buffered (high safety stock, zero stockouts) and which are under-buffered (chronic availability issues). Optimize based on evidence, not assumptions.
Embedded workflows. When safety stock should be optimized, Incorta can trigger workflows that update replenishment rules. Recommendations become action without manual intervention or IT dependency.
The result: teams optimize buffer inventory based on current conditions, freeing working capital while improving service levels.
See how other supply chain leaders are already winning with Incorta here.

