Incorta is a unified data and analytics platform that will forever change how you think about business intelligence. This video shows you what you can do with Incorta, and how to get started.
Product Demo Type: Getting started
Getting started with Incorta
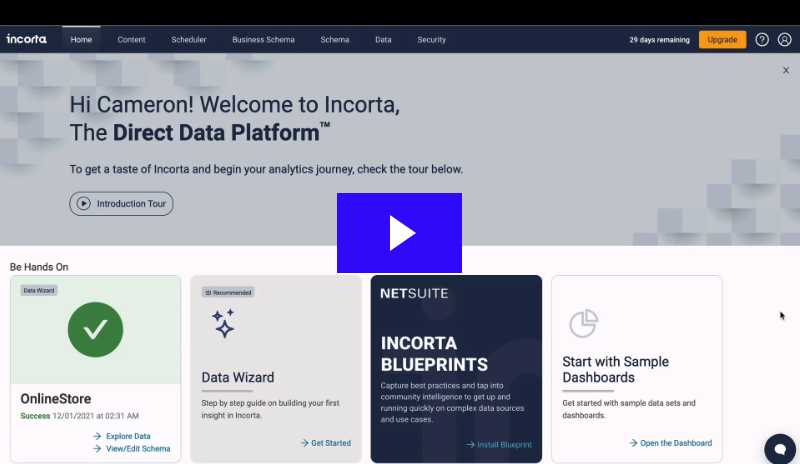
This video will show you how to get started with Incorta including how to sign up, log in and navigate the menus and the sample content.
Using the data wizard
Data in Incorta is designed to be continuously refreshed, so your data analysis is always up to date. However, setting up a data pipeline requires a step or two more than just uploading a file. This is where the Data Wizard comes in. The Data Wizard guides you through the steps of creating a data connection, populating a physical schema and loading the data.
Improve and streamline data navigation with business schema
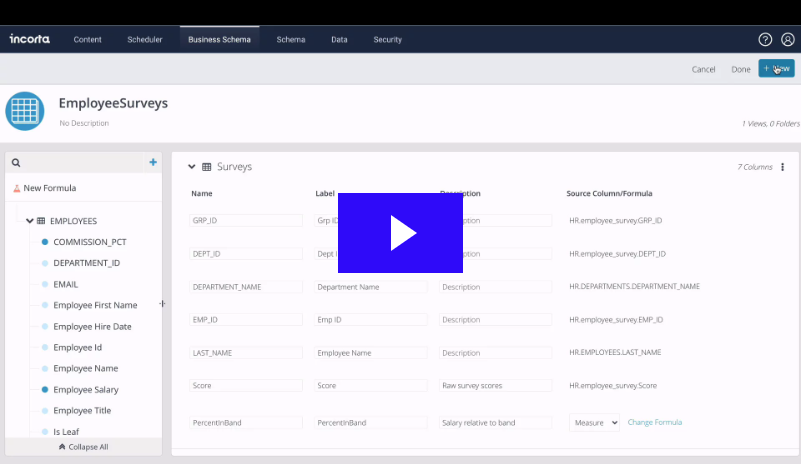
The Business Schema contains views that make it easier for users to navigate their data. Views can combine columns from multiple physical tables along with new formula columns. These views make it easier to understand and use data from complex sources, and also provide a layer of abstraction between physical tables and finished dashboards.
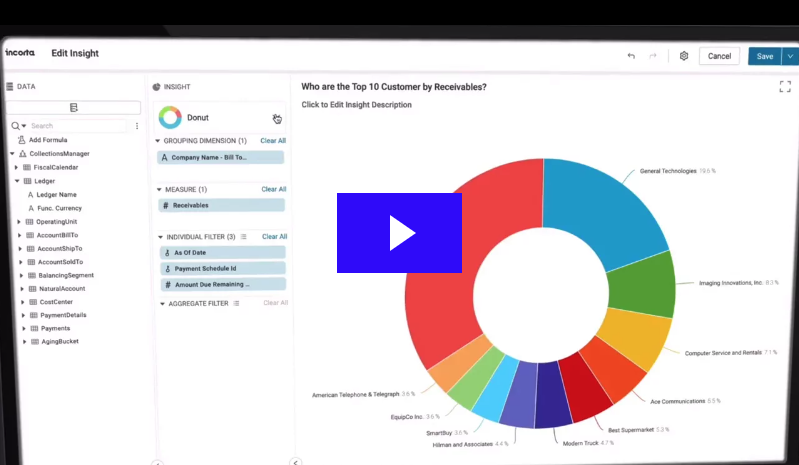
The Incorta analyzer
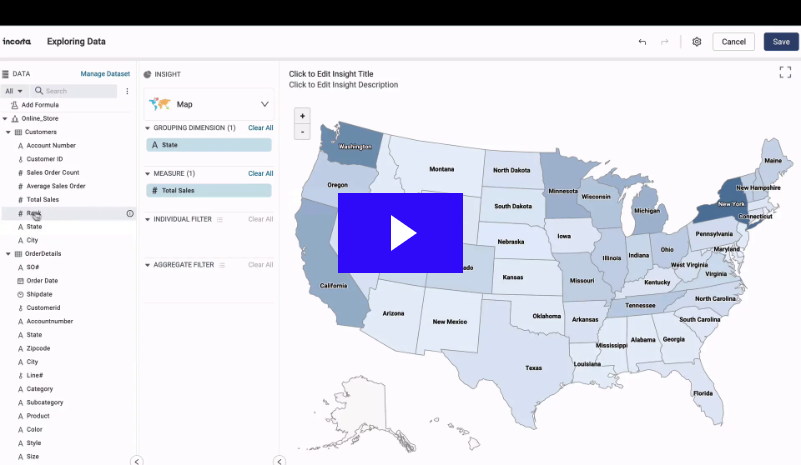
In this video, you’ll learn about the Incorta Analyzer, a visual tool for exploring your data, discovering insights and sharing with others.
Organize, unify and highlight business insights with dashboards
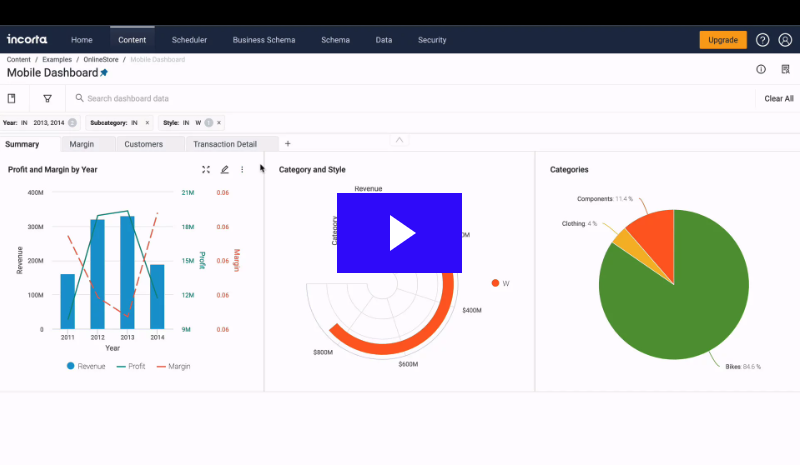
Incorta Dashboards let you organize and showcase your insights, and share them with others. In this video we cover how to create a dashboard, move and arrange insights, add filters and change layouts.
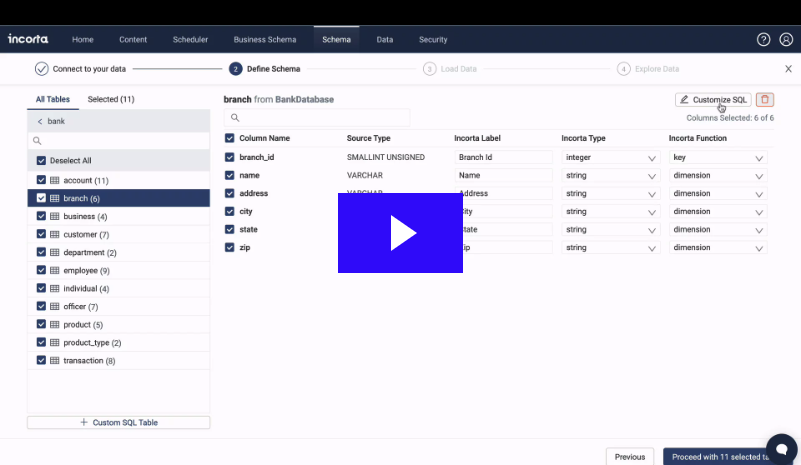
Working with Incorta schemas
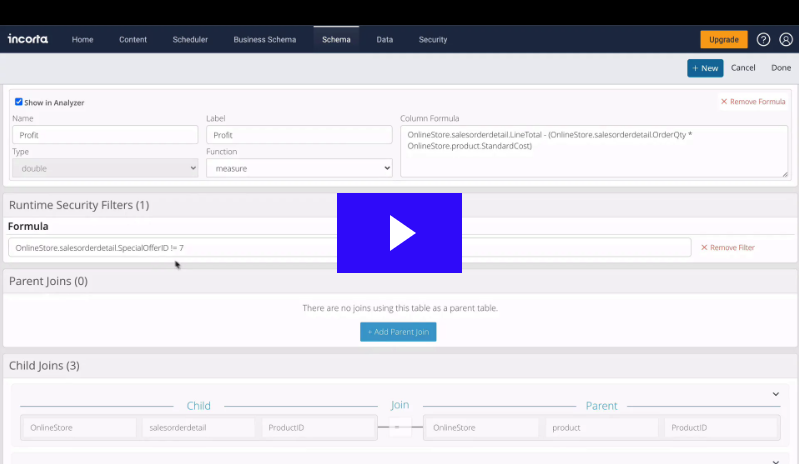
After creating a data connection, the next step in the Incorta pipeline is the schema, which describes the physical structure of the incoming data to be analyzed.