NetSuite users have long been frustrated with the native reporting and analytics options available through SuiteAnalytics, but building out a data warehouse and analytics solution is costly, and the process typically takes months. Fortunately, Incorta now has a solution for NetSuite that delivers the unmatched speed and direct simplicity of Incorta, but in a package that cuts implementation time by up to 80%.
Let’s review why we created Incorta for NetSuite and what it can do for your business.
SuiteAnalytics, Useful but Insufficient
SuiteAnalytics – an extra-cost option for NetSuite users – provides reports, simple queries, searches, KPIs, and pivot tables. These features are a good start but are not a complete analytics solution.
Users are limited to simple queries and a small set of charting options, and the primary analytic tool is pivot tables. When assembled onto dashboards, the charts are not interactive, and the tables, gauges, and other elements don’t update together.
In SuiteAnalytics, Datasets are the basis for tables, pivots, and charts. They must start with a ‘root’ data subset (i.e., Customer, Employee, Vendor) and cannot easily reach across functional areas. Metrics beyond a simple sum, average, or count must be coded in SQL, which is too complex for the average business user.
These features are useful in some respects, but don’t allow for rapid exploration and don’t provide the analytical power that today’s business teams need. And if the data you need resides in another system, you will need to do your analysis outside of SuiteAnalytics.
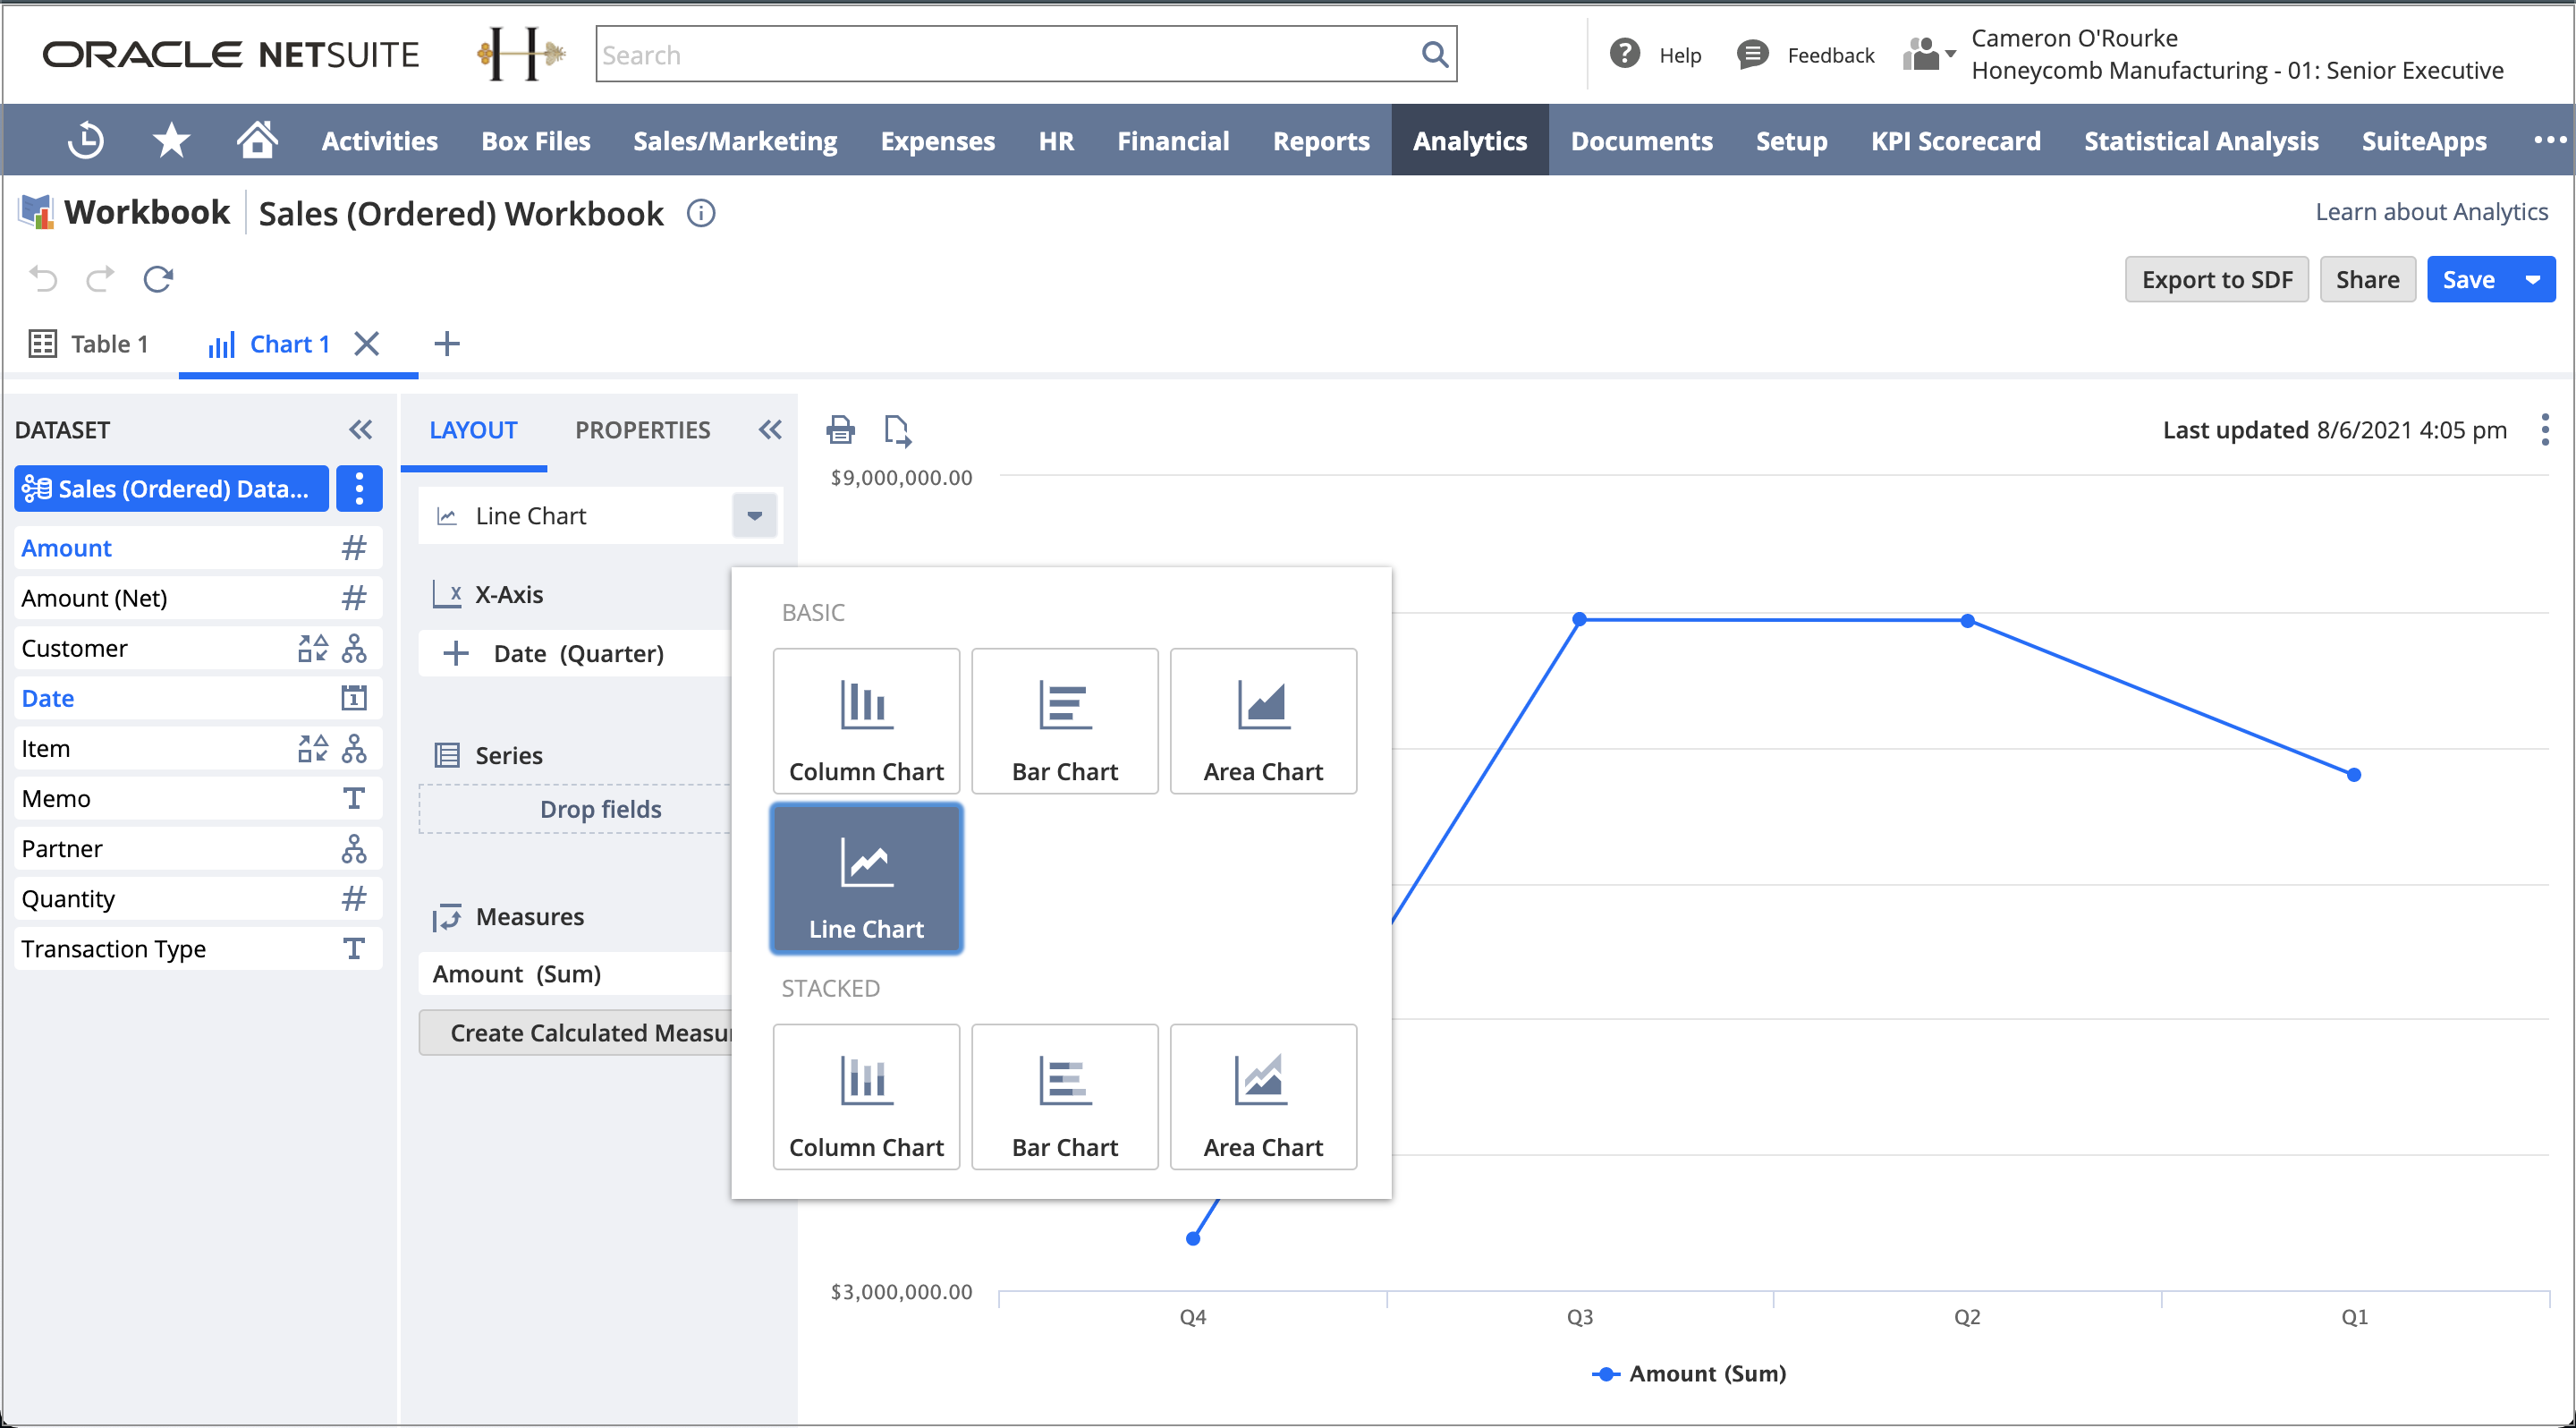 NetSuite workbook showing simple options for reporting and charts.
In fact, SuiteAnalytics users often resort to exporting multiple saved searches into spreadsheets, which means that errors can creep in, and the data can quickly become outdated. Or the IT team might spend all their time trying to keep a data warehouse populated and correctly structured, with barely any time left to deliver analytic solutions to their users.
Incorta excels at solving challenging data problems with our breakthrough technology that:
- Sidesteps the need for most data preparation for analytics
- Makes ERP data analytics-ready without extensive help from IT
- Easily combines data from multiple systems allowing cross-functional analysis
- Delivers excellent performance even against complex data
And now we have a way to bring the problem-solving power of Incorta to NetSuite users in literally minutes.
Introducing Incorta Analytics for NetSuite
Incorta users can now access our NetSuite Data App. This predefined analytics content package was built based on input from our customers and comes with everything needed to have you up and running in minutes.
The package includes NetSuite data definitions, business views, and pre-built visualizations and dashboards that demonstrate the power of a true data analytics system. You’ll be able to start finding fresh insights within your own NetSuite data in under an hour.
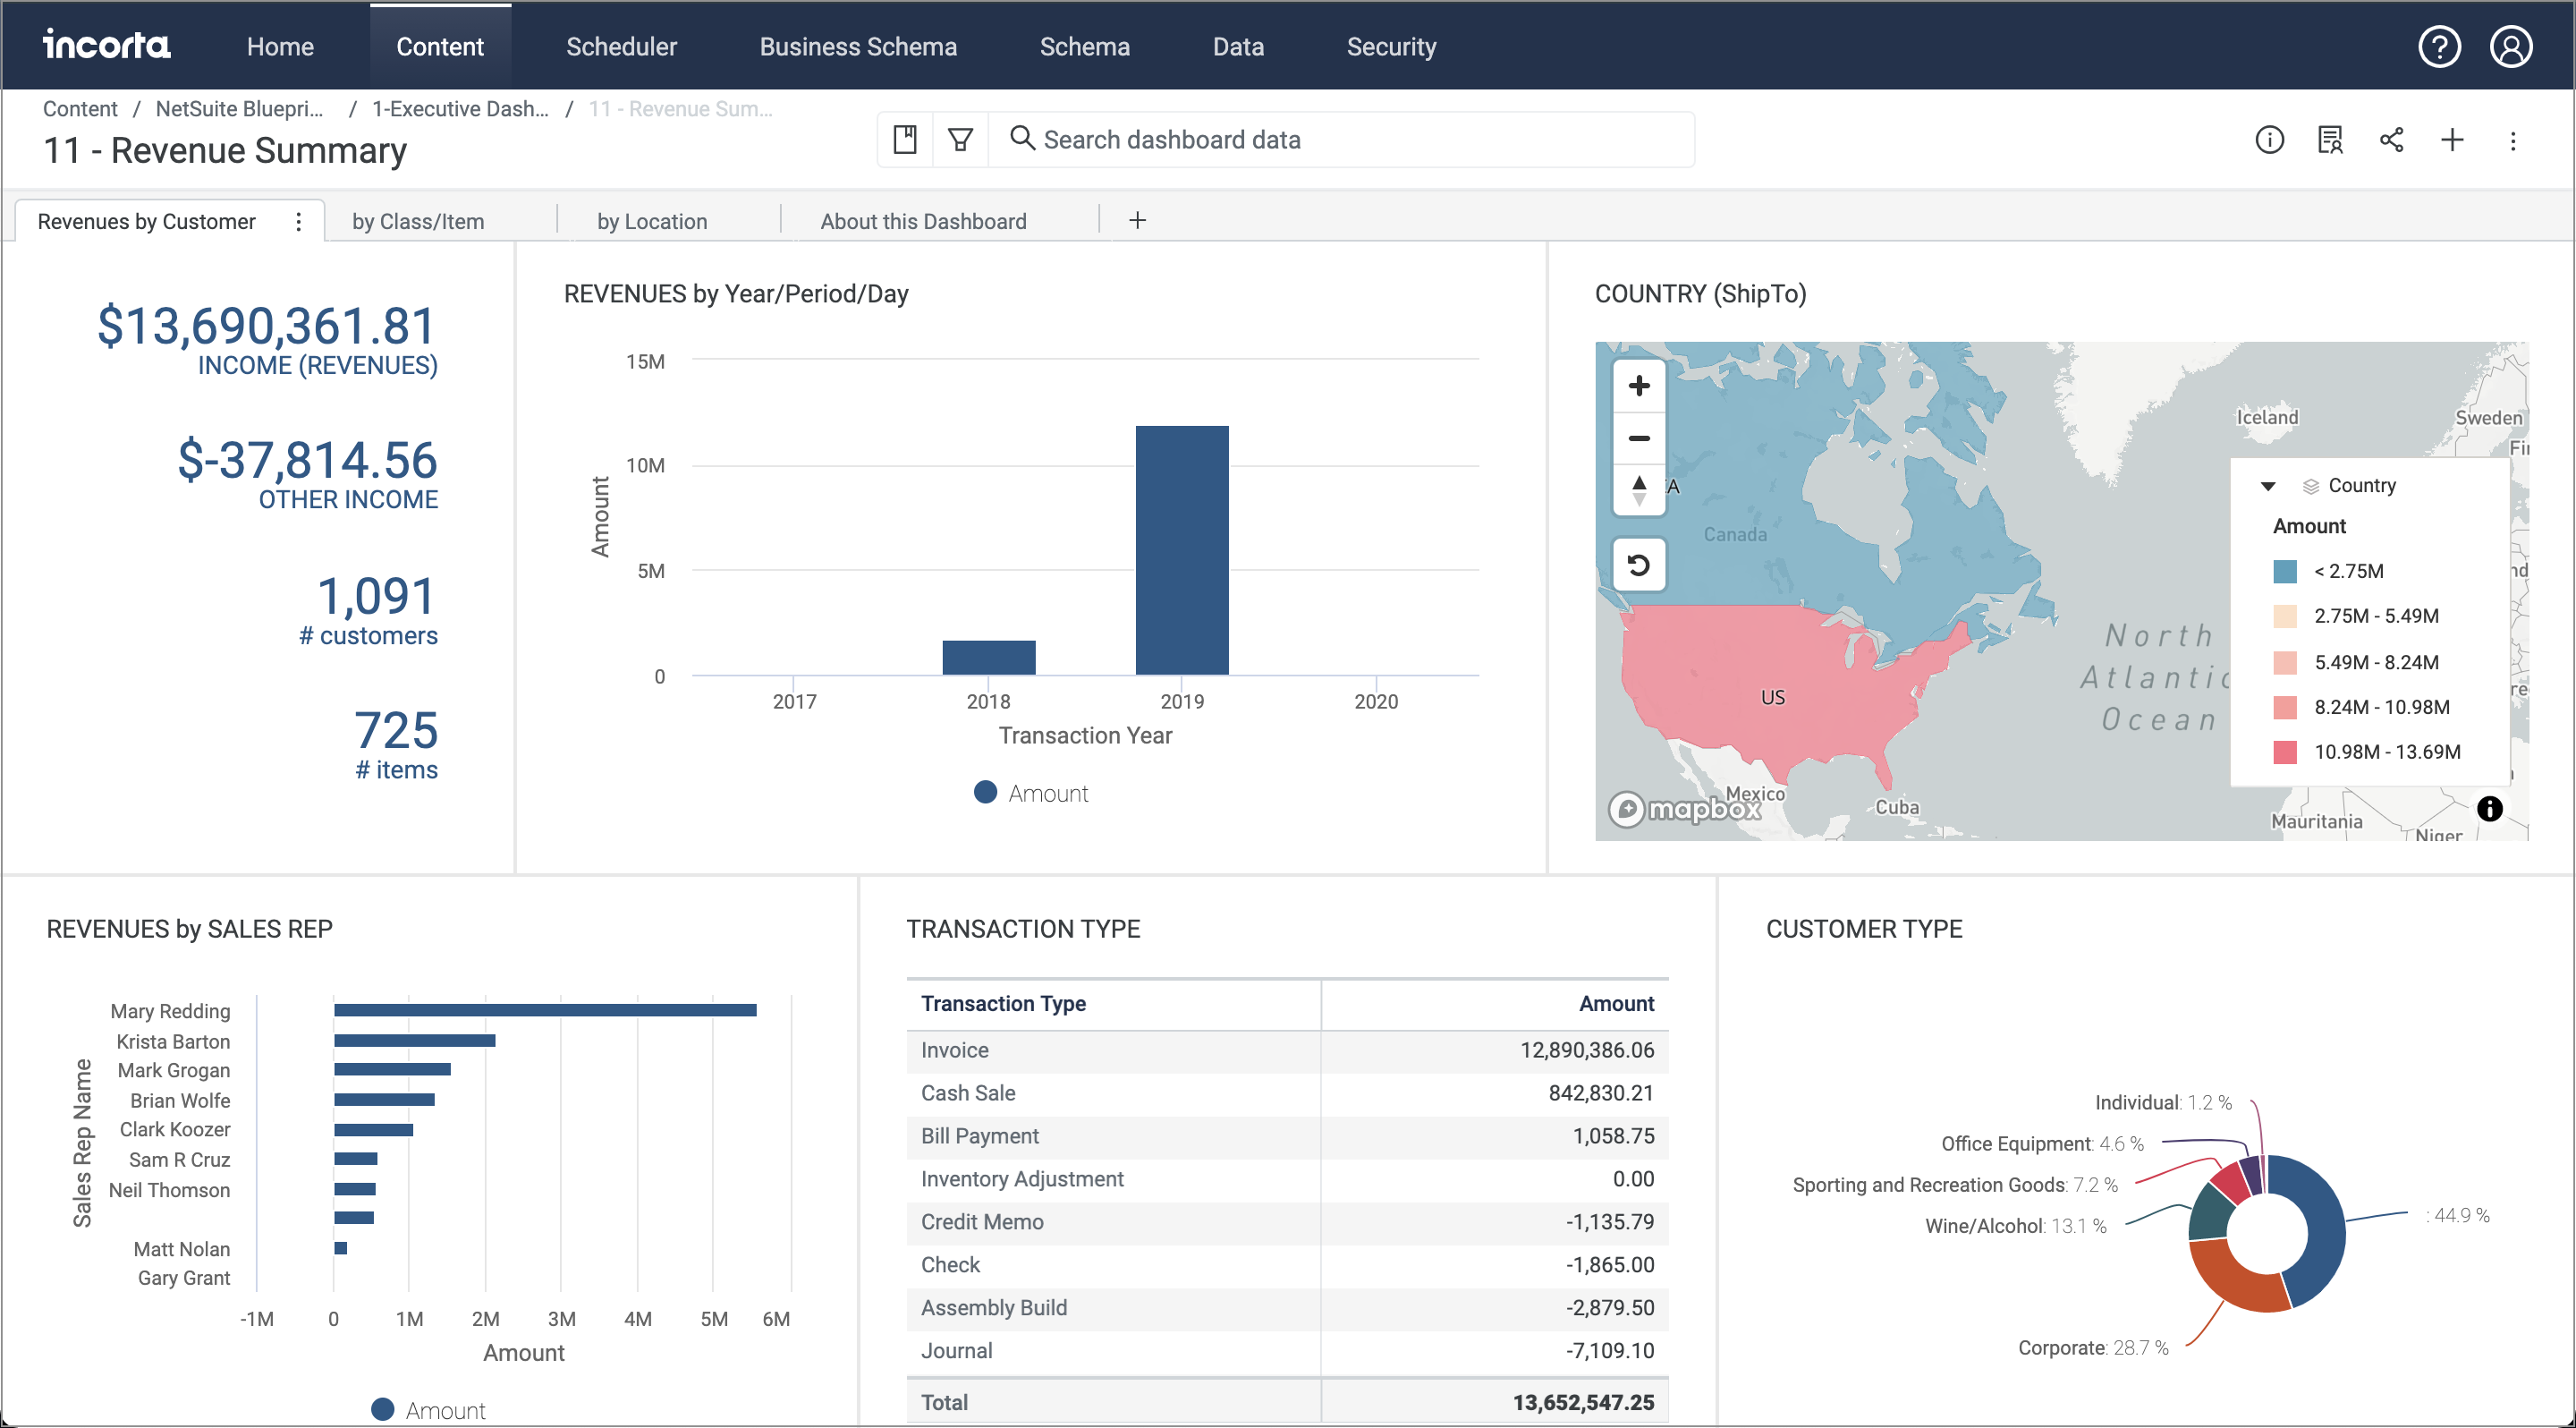
Incorta NetSuite Data App Revenue Summary dashboard shows tabs, personalization controls, sharing controls, and various chart types.
Built to Inspire
When asked why we built the Incorta for NetSuite solution, our CIO, Brian Keare said, “We wanted to show people what a superior analytics solution looks like. We want them to experience analytical power and flexibility that they haven’t seen before, and from there be able to imagine new possibilities for their business.”
With these newfound capabilities, executives and staff can rise above having to deal with one operational problem at a time. Instead of a limited view, they can see the overall business picture assembled from multiple sources, explore the data from multiple perspectives, and pinpoint trends and opportunities in their business.
For example, what if cash receipts are off, but sales are up? This is the kind of question that might typically set a war-room of analysts to work and take hours or days to work through all the questions. Are we shipping product? Is there a slowdown in manufacturing? Stockouts of critical components? Order cancellations? Quality problems? Vendor problems? Or a problem approving customer credit and orders?
With Incorta, you have the power to look across functional areas and even across different systems-of-record. Incorta also provides interactive, interconnected, and immediately updating visuals that speed discovery. Imagine quickly clicking through a heat map of product movements, with filters triggered by an interactive geographic map. Then, once the problem has been identified, you can drill into the supporting details to find and address the root cause.
This ability to ask many different questions in rapid succession, test a hypothesis, click into detail and arrive at an answer quickly is central to the Incorta experience.
Included Features
The Incorta NetSuite Data App comes with table definitions, relationships, and business views spanning accounting, HR, inventory, operations, sales, and support.
There are about 40 dashboards included in the package, covering executive summaries, finance, sales order management, operations-purchasing, HR-employee performance, audit, and the NetSuite environment. Many of the dashboards contain multiple tabs, include both high-level metrics and detail transaction tables, are clickable, and share filter settings. Everything included in the Data App is fully customizable.
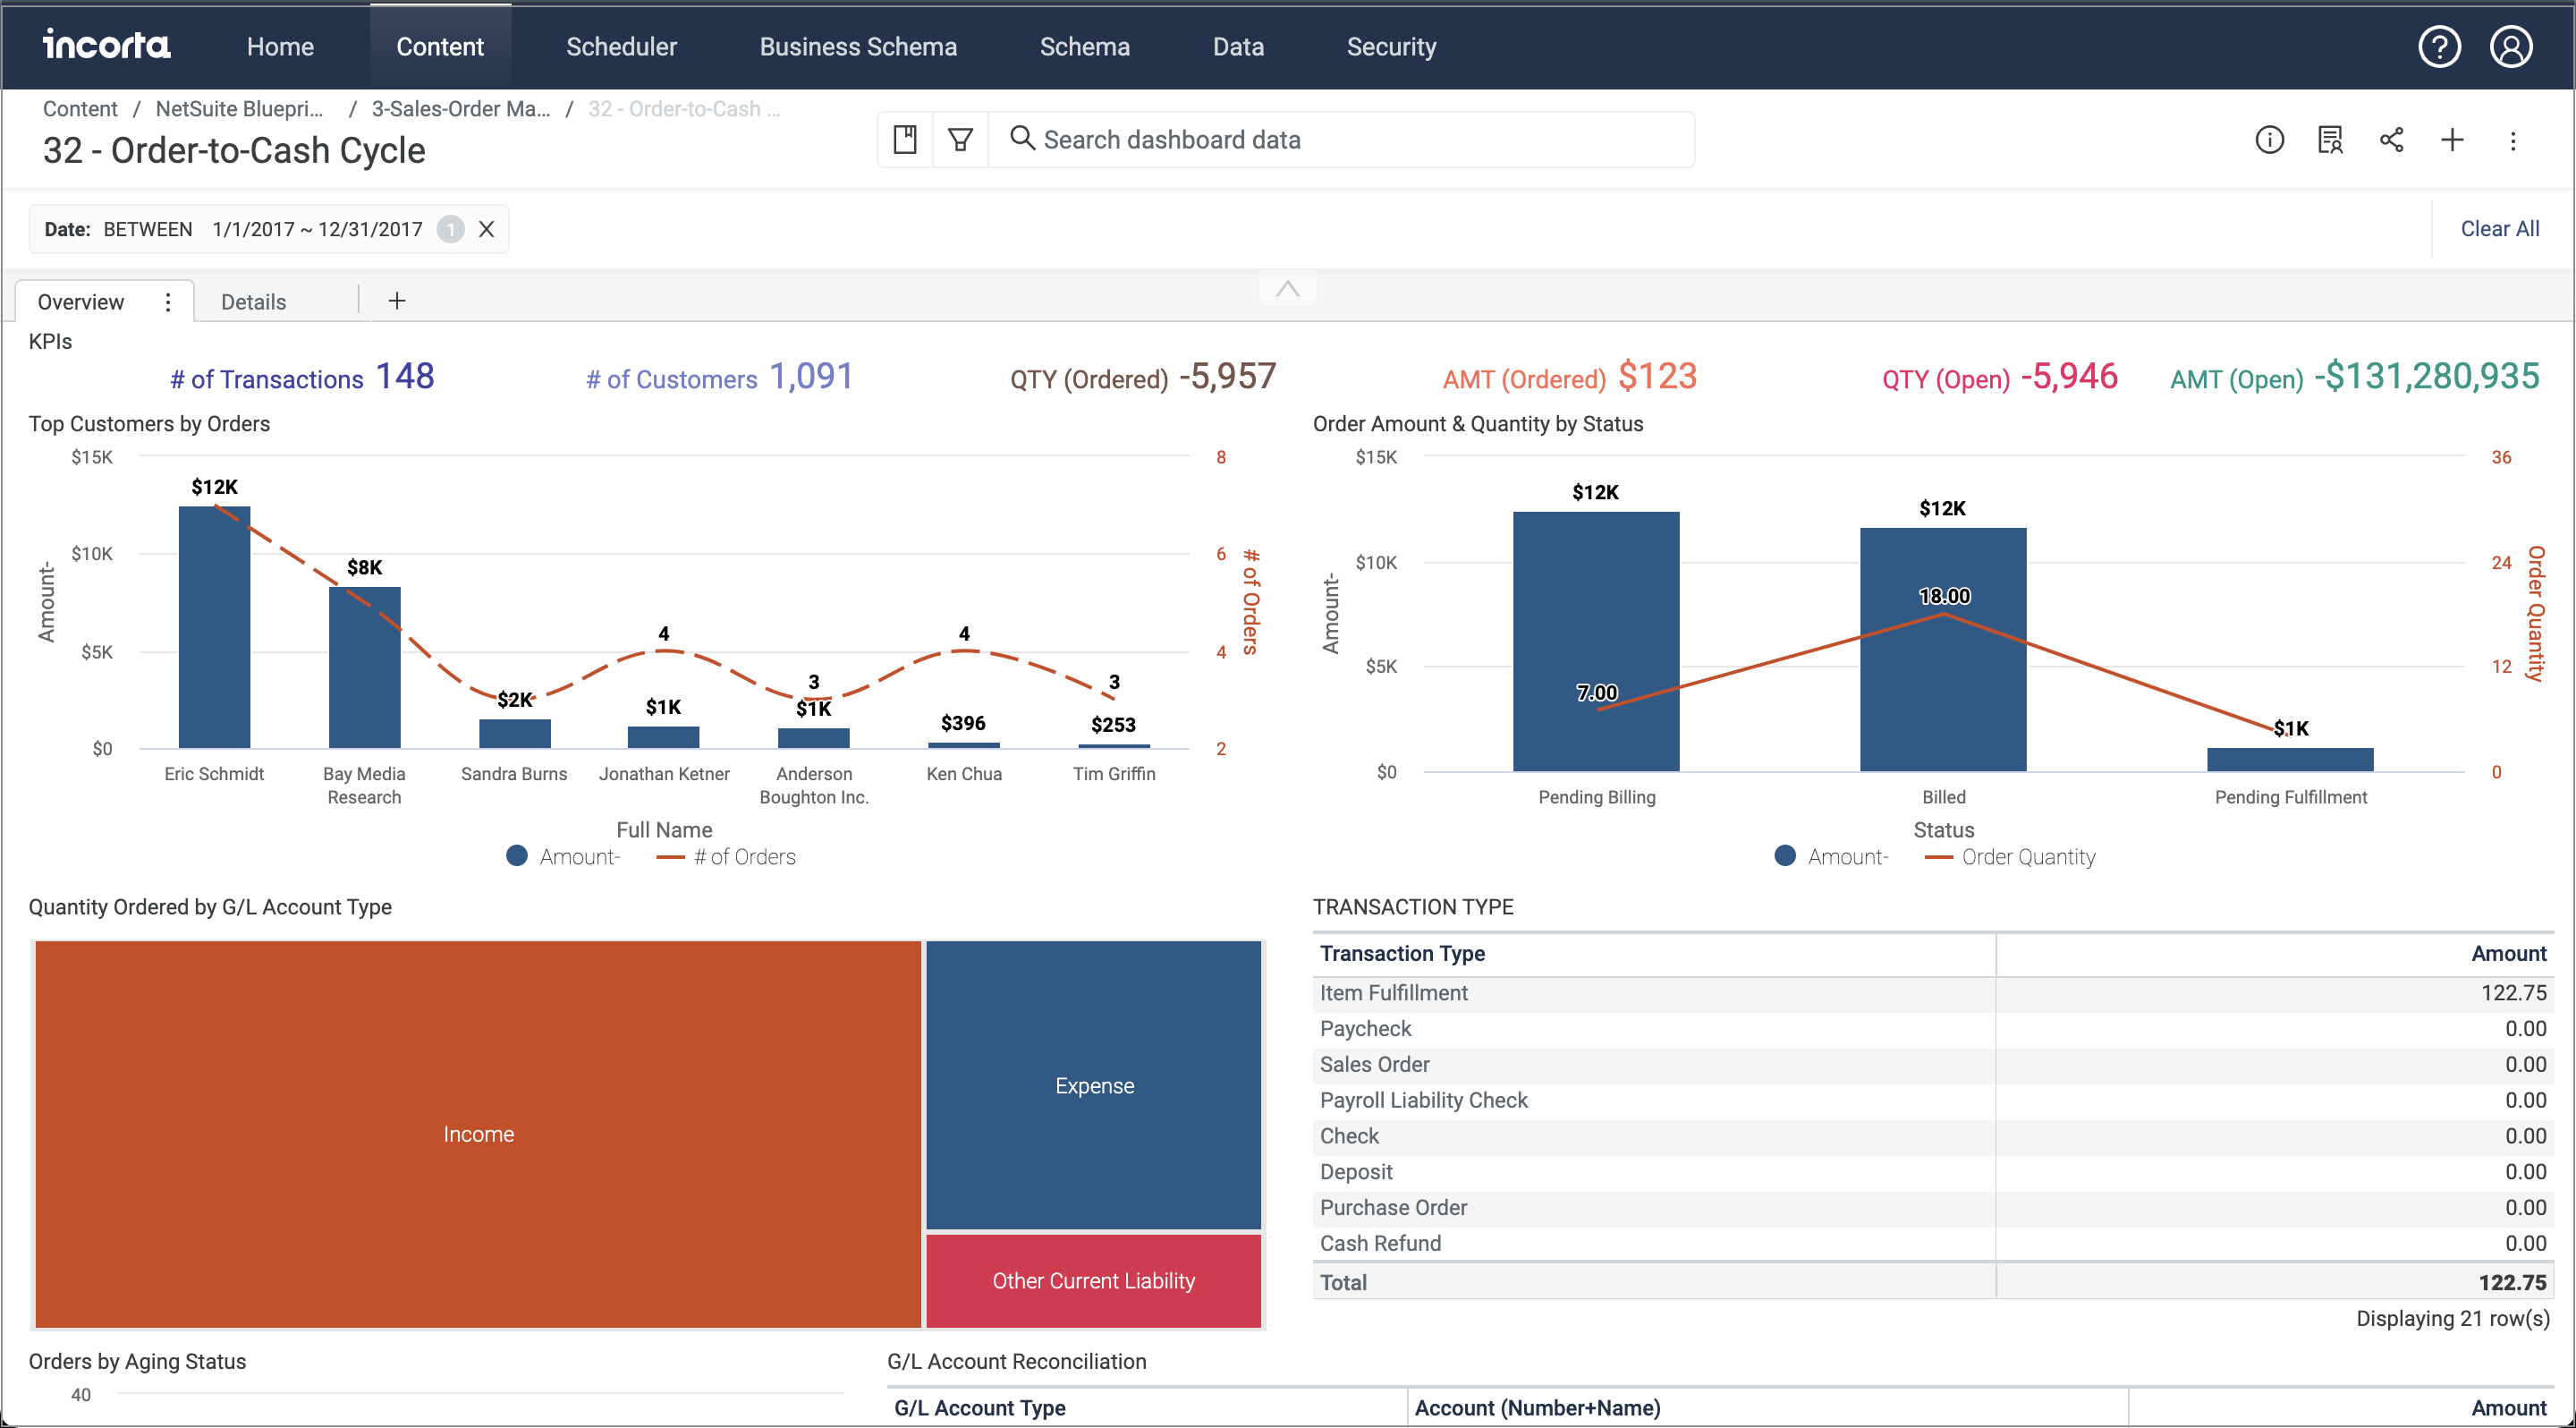 Incorta NetSuite Data App Order-to-Cash Cycle dashboard showing filtered data, tabs, and a variety of chart types.
Our NetSuite ERP customers love this solution as it allows them to freely explore their data instantly, in any direction they choose. In the words of one of our customers, this creates a “culture of data curiosity” that leads to new data discoveries, new business solutions, and profound changes in how decisions are made.
How to Get Started Today
Be up and running with Incorta Analytics for NetSuite in just minutes. You can get started for free. Once your Incorta cluster is set up, just click the Data Apps tab to continue.
If you aren’t ready to connect to your NetSuite data, attend our live weekly Incorta for NetSuite demo, or download the eBook for more details.
You don’t have to be a data engineer to light up your NetSuite data. Start here and be up and running in under an hour with a fully-hosted, modern analytics stack with the pre-built NetSuite analytics.
We can’t wait to see what you discover!