As the world of business grows more complex and real time, reducing time to insight with modern data analytics is the name of the game. In fact, the number one metric for every company today should be time to insight.
How do you calculate time to insight? It’s a function of two measures: (1) How quickly you can make new source data ready and available for analytics; (2) How quickly you can segment your data and query it in different ways.
The first is difficult. Everyone wants real-time data for analytics, but that’s easier said than done – even today with the availability of cheap, infinite cloud storage and compute. The second is even harder still. Every time you add new parameters to analytical queries and segment the data in different ways, time to insight gets dramatically worse.
Here’s an easy yardstick for determining where you stand today: If days are your unit of measure for time to insight, then you already have problems. And if you’re thinking about it in terms of weeks — or, worse yet, months — then it’s time for a serious wake-up call.
Strategic vs. Operational Decision Making Is a False Dichotomy
At the most basic level, what you’re after is the fastest possible time to insight. The faster you can ask and answer questions with data — and the more real time the data is — the faster you can make better decisions. Make more decisions better and faster than your competitors and you win.
But it’s more than that, really. The true beauty of slashing time to insight is how it changes the way you approach business decisions in the first place.
When time to insight drops from weeks or days to minutes or seconds, the line between “strategic” and “operational” decision making starts to blur. When you go from 400 to 70,000 queries a day, you quickly realize that “strategic vs. operational” decision making is a false dichotomy.
When people talk about “strategic” decision making, what they typically mean is “taking more parameters into account.” They are referring to the kinds of decisions where you want to be able to take your time and ask lots of questions. So-called “operational” decisions, on the other hand, generally refer to those which are fast and routine.
But what if it doesn’t have to be that way? What if it’s possible to make operational decision making more strategic and thoughtful, and strategic decision making more operational and routine? This is one of the greatest superpowers that unified data analytics platforms (UDAPs) like Incorta make possible.
Hamstrung by the Constraints of a Bygone Era
We tend to think about strategic vs. operational decision making as “slow vs. fast” because of the constraints historically imposed by data systems.
Ultimately, it comes down to the fact that source databases are not designed or equipped for analytics. The data inside source business systems (i.e., ERP, CRM, SCM, etc.) is stored in a format optimized for transactions (i.e., inserts, updates, and deletes) while maintaining data quality. If you want to run analysis on the data, you have to extract and transform it, and then load it into a separate environment that is purpose-built for analytics, like a data warehouse. The process of extracting, transforming, and loading data (ETL) is brutally slow and time-consuming.
And it gets even worse. With traditional data analytics architecture, every time you take a new parameter into account (by joining tables), the computational load grows exponentially. At a certain point, it doesn’t really matter how much computational power you have at your disposal — if your analytical query is sufficiently complex it fails because traditional architecture can’t handle the load.
To speed up the process, the first instinct for many is to limit the scope of the query. The next thing you know, you are separating routine queries, which rarely change, from more involved queries requiring investigation and adaptability. Before long, operational decision making is on autopilot.
And that’s all well and good if you’re operating in a world that doesn’t change much. But that’s not the world we live in today — not even close.
How a Unified Data Analytics Platform Reduces time to insight
The data analytics tech stack generally consists of five separate components: data source connectors, data transformation, analytical database, analytics engine, and data visualization. To generate insights, you have to move data through each layer of the stack, from the source database all the way up to the visualization layer. Each and every step of the way, you lose valuable time and context.
One of the greatest advantages of a unified platform is that you no longer have to manage five points of integration. In fact, you no longer even have to move your data in the first place. With unified data analytics, you bring the analytics to the data instead of the other way around .

This architectural paradigm shift speeds up time to insight in other impactful ways as well:
Single User Experience
Individuals and teams work better and faster in a single workflow. That’s why products like iMovie, Hootsuite, Peloton, or any number of other unified platforms are so popular and widespread today.
Jumping between multiple products with different user interfaces and experiences slows everything down — especially when it comes to data analysis. And then there are the technical roadblocks.

Incorta’s expanding ecosystem of data connectors simplifies the process of unifying enterprise data.
A single user experience, by contrast, helps people stay focused and productive by eliminating repetitive tasks, handoffs, and other technical roadblocks. With Incorta, for example, our single user experience and no-code design means that every user is capable of ingesting data and running analytical queries from start to finish. Even people who have never built analytical applications before can do it. That’s practically unheard of today.
The result is faster time to insight for everyone who touches data analytics.
Composability Everywhere
Data is difficult and expensive to move. The less you have to mess with it, the faster time to insight will be.
With a traditional data analytics technology stack, you are constantly moving data from one layer of the stack to the next, transforming it over and over again every step of the way. Once you transform the data and move it to another layer of the stack, that transformation is set in stone and there’s no way to easily go back and “undo” mistakes. If an issue with the data bubbles up later, it’s typically faster and easier to go back and start over from scratch.
With a unified data analytics platform like Incorta, this entire experience is different. Instead of moving data around all the time, you leave the data in the source database and run analytics against source data models replicated into an Incorta environment. This massively reduces the data transformation process and unlocks huge gains in time to insight. It also introduces new user experiences that were scarcely imaginable before.
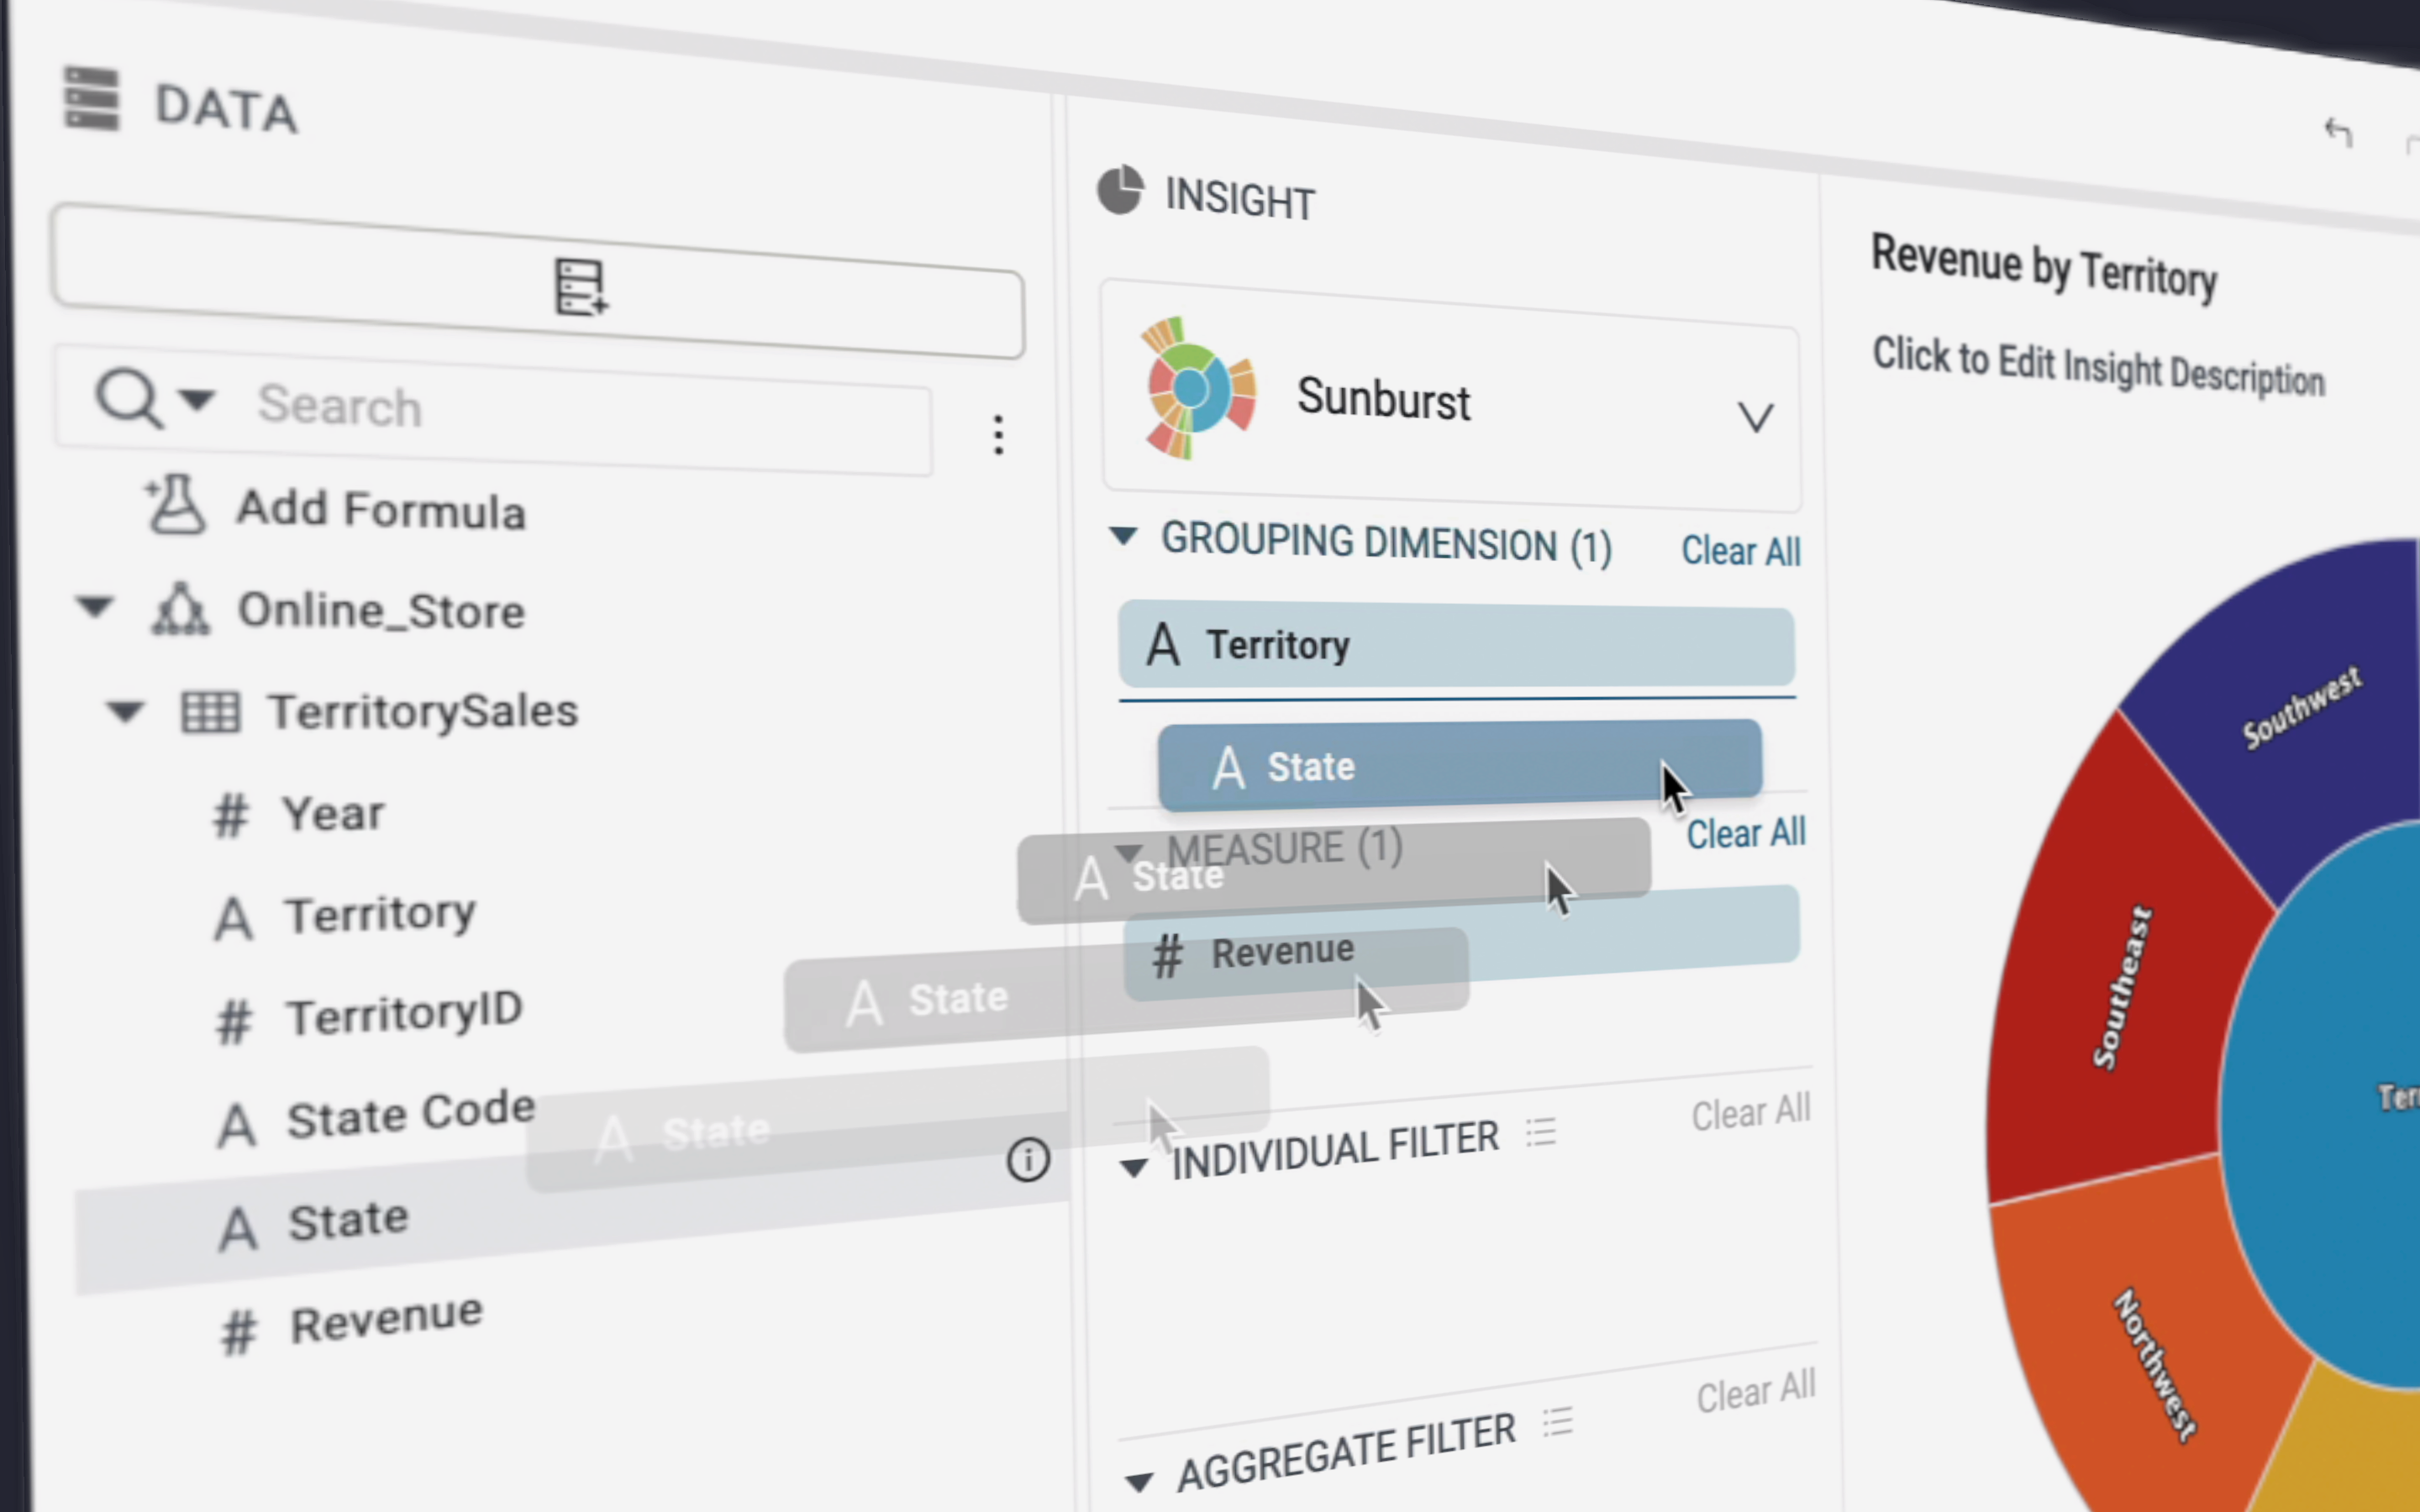 Incorta’s drag-and-drop user interface for composing analytical insights.
Essentially, Incorta enables you to “compose” analytical insights. You start at the base layer with raw source data — and leave it there — and then build up insights as you go. Every step you take builds upon previous steps and the entire composition history of the insight is immediately available for inspection.
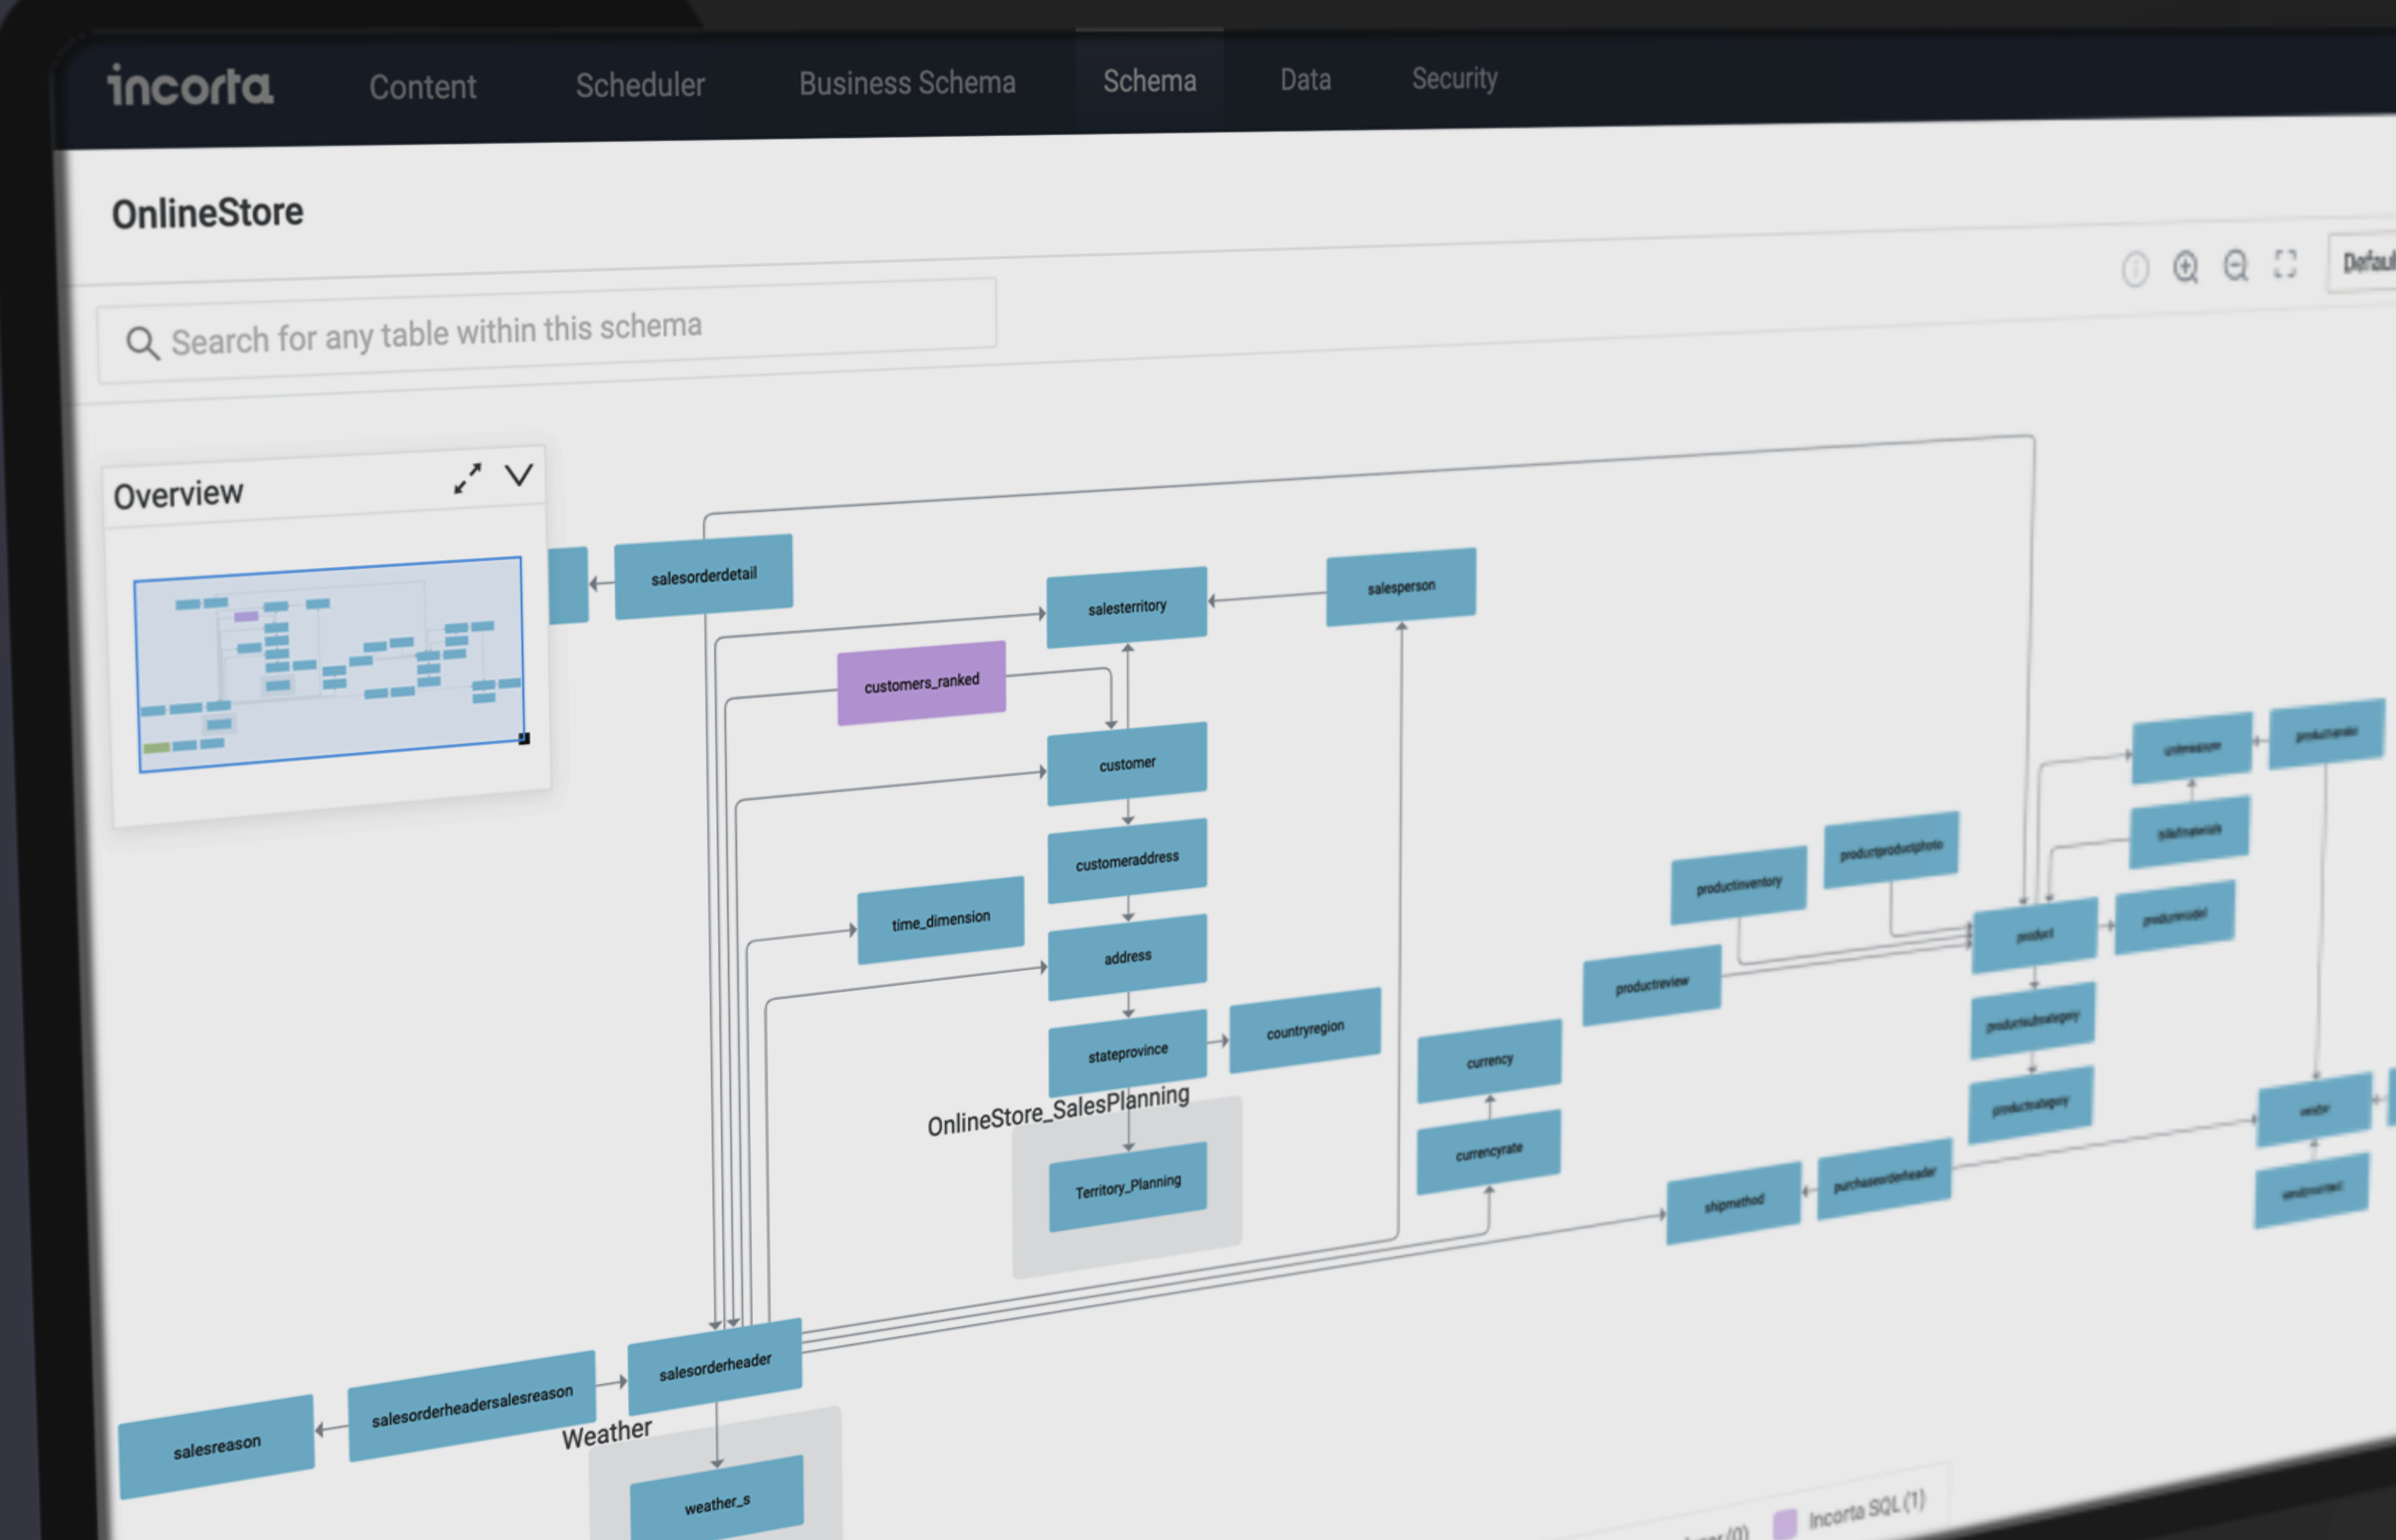 With Incorta, tracing an insight from the visualization layer back down to schema design is a point-and-click operation.
This makes it faster to generate insights on a per-query basis because it’s much faster, cheaper, and easier to move the analytical logic than it is the underlying data. But it also makes it faster on a broad basis as well because if you make a mistake — which, let’s face it, happens all the time — you don’t have to start over from scratch. Just roll it back, make your change, and see the impact. The same goes for when you want to explore different parameters and iterate your way to the ideal query as well.
Seeing Is Believing
Incorta challenges 30+ years of conventional wisdom about data analytics and the architecture that underpins it. Our unified platform helps companies to stay ahead of the accelerating rate, volume, and complexity of modern enterprise data. Incorta is built with open standards and integrates with cloud-friendly tools and platforms, making it easy to consolidate data in the cloud and extract meaningful insights. By making any data source continuously available for analytics, our unified platform helps business leaders, business teams, and data scientists make more accurate, timely, and transparent decisions with faster access to richer data sets.
To start closing the gap between strategic and operational decision making, spin up a free trial and try it out for yourself today.
*This article originally appeared on InfoWorld