It’s estimated that there will be 74 zettabytes of data created globally in 2021. That represents nearly 20% compound growth year over year (YOY) since 2019.
No wonder organizations today are drowning in data. We all feel it… Data is streaming in from everywhere. It’s coming from ERP systems, CRM and POS systems, supply chains — and that’s just the start. To further complicate matters, the widespread adoption of IoT devices is causing an explosion in unstructured data. This segment of data is growing at a rate greater than 60% YOY.
In an attempt to manage this, we have data routing to data lakes, data marts, warehouses, Excel spreadsheets, and BI tools. Even though we’ve been modernizing our data analysis pipelines with the latest technology for decades, the movement of data is still too sluggish and siloed — fundamental problems that remain unsolved.
To meet today’s demand for near-real-time data analysis, we need to modernize again — but with a fresh approach.
To date, modernization efforts typically focused on two main areas: increasing pipeline capacity and speed, and improving the end-user experience. Now it’s time to focus on streamlining and simplifying the middle part of the pipeline — the data transformation layer.
To level set, let’s first take a brief, high-level walk through the history of pipeline modernization. This should help make the challenge (and my view of the solution) very clear.
Rudimentary Pipelines
As I tell this story, I recognize that I’m dating myself … You see, I used to write queries for data coming from the IBM AS/400 computer system. Introduced in 1988, it was considered revolutionary because it included hardware, an operating system, and a proprietary database.
There was a data pipeline, albeit a very short one: Data streamed out, and you could use it to make decisions. Unfortunately, AS/400 was a very difficult programming language, and the time it took to create a simple green bar report was measured in months, if not years.
Considering all the time and resources that went into it, it was commonly accepted that a report like this would cost a company as much as $100,000. Even still, it was a big deal at the time, and considered to be worth the investment for some companies.

The Rise of Relational Databases
As the appetite to get information grew, we saw the rise of relational database players such as Oracle and Microsoft SQL Server, along with ETL vendors such as Informatica. With these new approaches, you could pull data out of an AS/400 database using an ETL process and put it into a relational database for analysis.
This was very exciting because it made the barrier to data much smaller. You didn’t have to be an AS/400 programmer to do the analysis. Instead, you only had to know SQL, which was much easier to learn in comparison.
This protracted the solution stack, yet sped up the process by months. Most significantly, it began to democratize the accessibility of data. A broader range of people could work with it, though you still needed specialized technical skills.
Drag-and-Drop BI
The next significant evolution came with the advent of the drag-and-drop BI vendors. This moved the refinement of data for decision making even closer to the end user. Brio Technologies, MicroStrategy, and BusinessObjects are but a few of the solutions that helped make access to data even easier. With tools such as these, the end user no longer needed to know a structured query language. They could simply drag and drop objects generated in the tool, blissfully insulated from the SQL working on the backend.
Despite these advancements, we were still stuck with the original challenge: take the data out of an AS/400 or an ERP system, and ETL it into an Oracle or SQL Server. Since the ultimate destination was a business user, we also had to get it translated into a format far more digestible than the one it was stored in.
This added yet another layer into the mix — a metadata layer to translate the language of the database into the language of the business. This was sometimes within the BI tool, but not always. Again, the pipeline for accessing information grew longer and more complex.
We dealt with it, because it also got faster and easier for the end user to get access to information. We seemed to be advancing on the problem. But, the situation was somewhat similar to trying to fill a bucket with water while someone else is randomly poking holes in the hose you are using to fill it up. Meanwhile, the volume and velocity of data that need to go through the pipeline kept growing and growing.
MPPs and Hadoop
To address the growth in volume and demand for data, the next phase of modernization aimed to increase the diameter of the pipeline itself. We continued our quest for speed and accessibility, this time with more powerful appliances. MPPs (Massively Parallel Processing systems) such as Netezza and Teradata could speed up Oracle databases. Widespread adoption of the data warehousing methodologies of Ralph Kimball also made data access faster and easier.
With the dawn of the so-called “big data” era, Hadoop became very popular, largely because it was a free and completely open platform that you could put all kinds of unstructured data into. This helped firms handle the wider variety of data being generated by internet applications.
In some instances, they could even replace Oracle and SQL dependencies with Hadoop and go much faster. End-user reporting that used to take 30 minutes or an hour could be done in minutes. The pipeline got even more complex, but once again faster because of the database technology.
In-Memory and Cloud
However, as more pressure was applied to Hadoop, it became apparent that it doesn’t do so well with structured data from the data warehouse. At the same time this was happening, RAM was becoming much less expensive. This led to the development of very fast, in-memory databases such as SAP HANA.
Machines to accommodate in-memory databases were still very expensive though, giving rise to yet another advancement: completely serverless cloud data warehouses such as Google BigQuery and Amazon Redshift. These promised all of the same speed and agility, and now you didn’t even have to own and manage your own data warehouse. Notably, this advance actually reduced some of the complexity for IT.
Reducing Time to Insight
At this point in the story, we are well into the internet era, and business users are accustomed to working with data. They have new expectations, as well as new reporting and analysis requirements — all of which create more demand for reporting tools, turning this subsegment into a proper market in its own right.
Meanwhile, BI is being modernized by players like Tableau and later, Looker (now a Google product). These tools allow people to visualize information on the fly, and they make those early BI systems look like band-aided report writers. The experience of visualizing information is now much richer.
We’ve come a long way from spending a year and $100K to pull a report out of an AS/400. But despite all of this advancement, we’re still reliant on that sluggish middle layer, the source-to-extract-to-transform-to-format-to-distribution pipeline. In fact, even the most powerful BI tools available remain reliant on this costly, burdensome framework.
We keep trying to fill the bucket, and more holes keep opening up in all these various layers of the pipeline.
Modernizing with Incorta
The next phase of pipeline modernization is addressing those holes. It’s about solving three challenges: reducing the cost, reducing the complexity, and reducing time to insights.
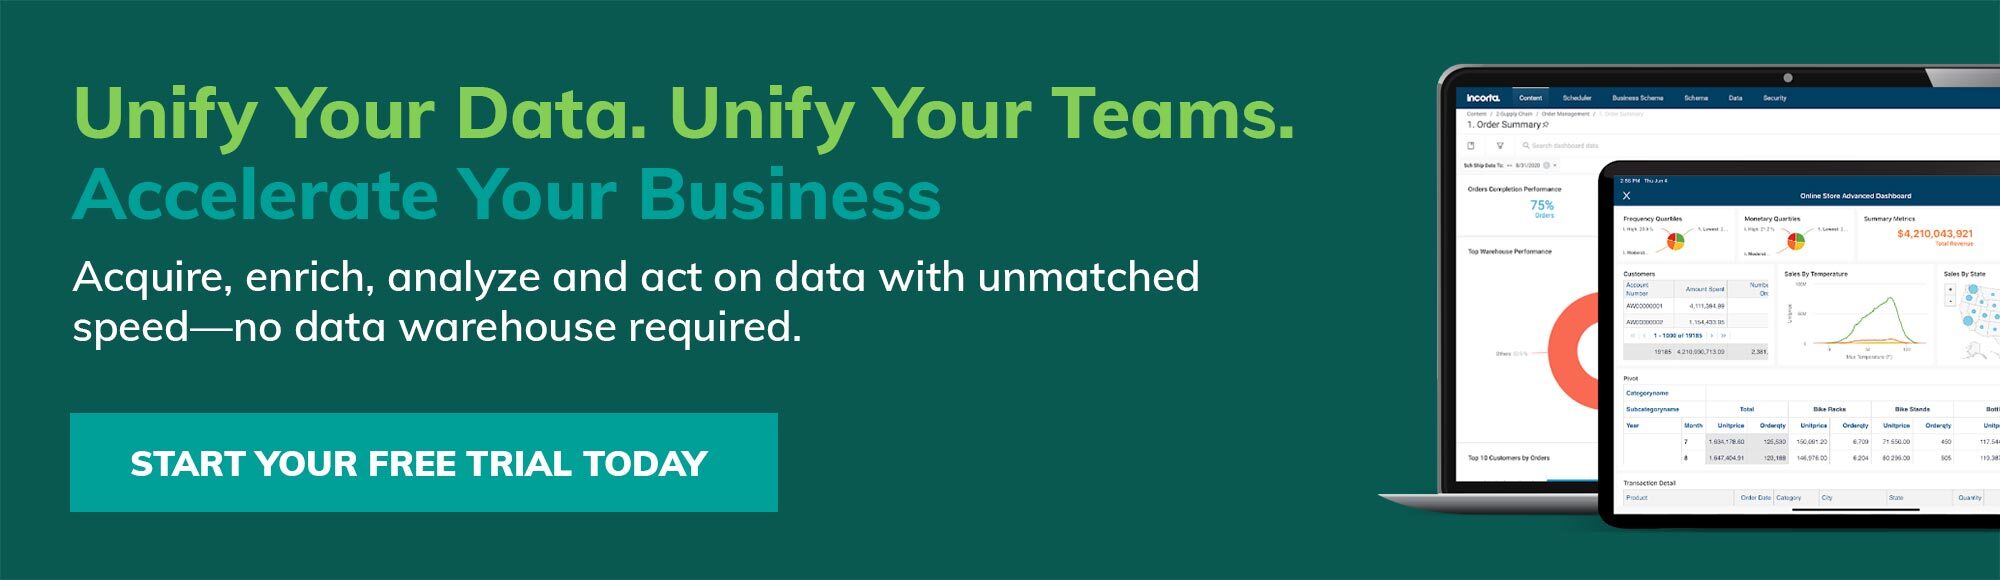
How do you attack these challenges? By modernizing the middle with a technology such as Incorta. From my point of view, this is the only true platform in the market that really streamlines that data pipeline and delivers insights in real time.
That’s important because today’s market demands no less.
If I could go back in time, my AS/400-querying self would be amazed by all the information and reports we can get today, and the speed with which we can get them.
But looking at it now, that’s like getting your internet via a 9,600 baud dial-up connection. You would go nuts. Today we expect to connect to the internet in seconds, and for the most part we can. We want to connect to our data seamlessly and effortlessly in seconds too. We’re not there yet, but now we have the tools we need to get there.