


G2 publishes its reports four times a year. Placement comes from verified reviews written by people who use the product at work, scored on satisfaction and market presence. Vendors cannot buy a badge.
Here are the headline recognitions from this quarter:
BadgeCategorySegmentEasiest SetupEnterprise Data PreparationEnterpriseEasiest AdminEnterprise Data PreparationEnterpriseEasiest To UseEnterprise Data PreparationEnterpriseMomentum LeaderData PreparationOverallMomentum LeaderAnalytics PlatformsOverallHigh PerformerData FabricOverallHigh PerformerData PreparationOverallHigh PerformerAnalytics PlatformsOverallHigh PerformerData Science and Machine Learning PlatformsOverall
Fifteen badges in total, spanning four data and analytics categories.
The three usability badges came from the same category and the same segment: Enterprise Data Preparation, scored by reviewers at companies with more than 1,000 employees. Those are the environments where data platforms usually get hard. Dozens of source systems. Years of customizations in ERP. Security models that took a decade to build.
Enterprise data prep has a reputation for long deployments and heavy administration. Teams budget quarters for a rollout and then staff a small group to keep the pipelines healthy. Winning Easiest Setup, Easiest Admin, and Easiest To Use in that segment says the day-to-day experience holds up under real enterprise conditions.
The reason traces back to how the platform works. Incorta reads data directly from source systems and keeps the original detail intact, so teams skip the modeling and transformation layers that make traditional stacks slow to stand up and expensive to maintain. Fewer moving parts means a shorter path from connection to first dashboard, and less work to keep everything running after go-live.
The badges land in four categories that most vendors treat as separate products: Data Preparation, Analytics Platforms, Data Fabric, and Data Science and Machine Learning Platforms.
That spread matters for buyers. A typical modern data stack stitches together an ingestion tool, a warehouse, a transformation layer, a BI tool, and a separate environment for data science. Every handoff adds cost, latency, and one more place for numbers to drift apart. Being recognized in all four categories at once reflects a platform that covers that ground in one place, on live data, with the detail preserved end to end.
For teams building AI on top of their data, the same point applies. Models and agents are only as good as the data underneath them. A platform that already handles preparation, delivery, and analysis gives AI a single, governed source of context instead of five partial ones.
The Momentum Leader badge in Data Preparation and Analytics Platforms measures growth. G2 calculates it from review velocity, satisfaction trends, and market signals over time, which makes it a read on where a product is heading rather than where it has been.
Two Momentum Leader badges alongside four High Performer badges tells a consistent story: customer satisfaction is high, and more customers keep arriving.
G2 badges come from verified user reviews. Reviewers confirm their identity, describe their company size and role, and answer detailed questions about the product.
Because scoring resets every quarter and recent reviews carry more weight, badges reflect how the product performs now.
Analyst reports tell you what a firm thinks of a vendor's strategy. G2 tells you what the people running the software say about it after go-live. Both are useful, and they answer different questions.
If your shortlist includes platforms that promise to unify data preparation, analytics, and AI, three questions are worth asking every vendor: how long until the first working dashboard, how many people it takes to administer once it is live, and whether business users can answer their own questions without filing a ticket. The Fall 2026 badges are Incorta customers answering those three questions.
How many G2 badges did Incorta earn in the Fall 2026 reports?Incorta earned 15 badges in the G2 Fall 2026 reports, across Data Preparation, Analytics Platforms, Data Fabric, and Data Science and Machine Learning Platforms.
What does the G2 Easiest Setup badge mean?Easiest Setup is awarded based on implementation scores from verified user reviews. Reviewers rate how long deployment took, how complex it was, and how well it met expectations. Incorta earned it in Enterprise Data Preparation for Fall 2026.
What is a G2 Momentum Leader?A Momentum Leader is a product with the strongest growth signals in its category, calculated from review velocity, satisfaction trends, and market presence over time. Incorta is a Momentum Leader in Data Preparation and Analytics Platforms for Fall 2026.
What is the difference between a G2 Leader and a High Performer?Both reflect high customer satisfaction. Leaders also have large market presence, measured by review volume, company size, and web presence. High Performers earn top satisfaction scores with a smaller market footprint.
How does G2 define the enterprise segment?G2 assigns reviews to segments by the reviewer's company size. The enterprise segment covers companies with more than 1,000 employees.
Which G2 categories is Incorta recognized in?Incorta holds Fall 2026 badges in Data Preparation, Enterprise Data Preparation, Analytics Platforms, Data Fabric, and Data Science and Machine Learning Platforms.
Where can I read Incorta reviews on G2?Verified customer reviews are published on Incorta's G2 profile at g2.com.
Read the reviews behind the badges on Incorta's G2 profile, or book a demo to see how fast a live enterprise data environment comes together.
Most enterprise data platforms were designed to answer a question: What happened?
But AI is increasingly being asked a different one: What should happen next?
Take a simple example. A dashboard can tell you inventory is running low. An AI-powered workflow might recommend a reorder, identify at-risk suppliers, and surface downstream impacts before they affect the business. Those outcomes depend on access to the operational data that reflects what is happening across the business right now.
As organizations move from reporting to AI-driven workflows, operational systems are becoming more than systems of record. ERP, finance, supply chain, and other operational systems contain the signals that reflect what is happening across the business right now. Making that data available to analytics and analytics and decision-support workflows is becoming critical as organizations look to respond to changing business conditions in real time.
Incorta helps organizations bring live ERP and operational data from systems such as SAP, Oracle, Workday, and NetSuite into BigQuery while preserving the relationships, hierarchies, and business rules embedded within those systems. Using Direct Data Mapping™, Incorta maintains the structure of source applications, reducing the need for extensive transformation and modeling before data can be used across reporting, machine learning, and AI initiatives.
On Google Cloud, BigQuery becomes an operational foundation where Gemini and AI-driven workflows can work from the same trusted business data. Instead of relying on separate data pipelines for reporting, forecasting, and operational workflows, teams can work from a common foundation that reflects current business conditions and keeps decision-support systems aligned.
That allows AI to operate on current business signals rather than historical snapshots. It can help identify potential supply chain disruptions as conditions change, recommend inventory actions based on current demand signals, surface financial risks before they escalate, or initiate next-step actions directly within business workflows.
The value of operational data extends beyond reporting and visibility. It creates the foundation for systems that can increasingly support decisions and actions using the same trusted business context that powers analytics today.
For data and AI leaders, the opportunity is not simply faster reporting. It is the ability to operationalize AI on top of the systems that already run the business. Instead of creating separate data architectures for analytics, AI, and future initiatives, organizations can build on a shared operational foundation that supports all three.
As AI adoption continues to accelerate, the organizations that move fastest may not be the ones with the most data. They may be the ones that can turn operational data into action.
Learn more: Explore Incorta on the Google Cloud Marketplace to see how Incorta and Google Cloud help operationalize AI on top of trusted enterprise data.
Enterprise data contains the relationships, workflows, and business logic that make organizations run. A shipment, for example, is more than just a record. It connects suppliers, inventory, forecasts, fulfillment timelines, and customer commitments. An invoice is tied to contracts, approvals, and payment terms.
As organizations deploy AI more broadly, those connections become increasingly important because AI needs to understand how the business actually works, not just what each record says. Yet the relationships that connect data across the business can become harder to preserve as information moves between operational systems, warehouses, and analytics environments. When AI can only see fragments of the underlying business process, recommendations become less reliable and harder to operationalize.
Incorta and Google Cloud help make enterprise systems usable for AI without requiring organizations to reconstruct the relationships and business logic embedded in their data from scratch.
Incorta helps organizations bring complex ERP and operational data into BigQuery without stripping away the relationships and rules that give it meaning. Using Direct Data Mapping™ and its semantic layer, Incorta preserves the business structure already embedded in source systems, so teams can bring ERP and operational data into BigQuery without losing the relationships, hierarchies, and business rules that make it useful for analytics and AI.
On Google Cloud, that contextualized data becomes available in BigQuery, where it can support analytics, Gemini, and other AI-driven workloads. Instead of starting with raw replicated records, organizations start with data that retains the relationships, hierarchies, and business rules needed to make data truly AI-ready.
Together, Incorta and Google Cloud help establish a shared foundation for analytics and AI, reducing the effort required to reconstruct business logic every time a new use case emerges.
When enterprise relationships, business rules, and operational context remain intact, the same foundation can support analytics, AI, and emerging agentic workflows without requiring teams to rebuild business logic for every use case.
A supply chain model can work from the same operational context used by an AI agent. A financial forecast can incorporate the same business relationships already used for reporting and analysis. Rather than creating separate pipelines, semantic definitions, and data models for every new initiative, organizations can extend a trusted business structure across analytics and AI.
For data and AI leaders, that operational foundation creates a more scalable path to operationalizing AI. New analytics, AI, and agentic use cases can build on the same trusted data foundation rather than requiring separate pipelines, semantic definitions, or data models for every initiative.
As enterprises move beyond experimentation, helping AI understand how the business works is becoming just as important as giving it access to the data in the first place. That understanding is what enables organizations to move from reporting on the past to acting in the present.
Learn more: Download Onramp to the Integrated Data Superhighway for AI Agents to explore how Incorta and Google Cloud help create a trusted foundation for enterprise AI. Or find Incorta on the Google Cloud Marketplace to get started.
For years, data teams focused on making enterprise data more accessible. Data replication solved an important problem: access.
Once data reached modern cloud platforms, teams could analyze it, report on it, and build applications around it. For many analytics initiatives, that was enough.
AI introduces a different set of requirements.
Analytics and AI consume data differently. Analysts can interpret missing context, reconcile inconsistencies, and apply business knowledge on their own. AI systems rely much more heavily on the structure embedded in the data itself.
A replicated purchase order may contain all of the underlying data, but not the relationships that connect it to suppliers, inventory, approvals, and downstream business processes. When those relationships are lost, AI can still retrieve information correctly, but struggle to reason across systems, workflows, and decisions.
Incorta helps organizations bring complex ERP and operational data into BigQuery without stripping away the relationships, hierarchies, and business rules embedded within it. Using Direct Data Mapping™ and its semantic layer, Incorta preserves the business structure already embedded in source systems, reducing the need to reconstruct that logic after data has been moved.
On Google Cloud, BigQuery provides a scalable environment where operational data, analytics, and AI can work from the same foundation. Google’s Gemini models and other AI-driven workloads can build on the structure already preserved within the data instead of requiring teams to recreate it.
AI-ready data becomes more valuable as organizations extend the same foundation across analytics, AI, and future workloads. By preserving business structure at the data layer, Incorta collaborates with Google Cloud to make it possible to support AI assistants, forecasting, analytics, and future agentic workflows from the same trusted foundation.
When the relationships and business rules behind enterprise data remain intact, the same foundation can support analytics, AI, and future use cases without creating new pipelines, semantic definitions, or data models each time requirements change. That means teams can spend less time reconstructing logic and more time extending a shared data foundation into new analytics and AI workflows.
For data and AI leaders, that trusted foundation creates a more scalable path to operationalizing AI. New analytics, AI, and agentic use cases can build on the same trusted business structure, reducing the effort required to bring AI into additional workflows, teams, and processes.
The value of AI-ready data extends beyond analytics. It creates the foundation for systems that can increasingly support decisions and actions across the business.
Learn more: Download Onramp to the Integrated Data Superhighway for AI Agents for a deeper look at how Incorta collaborates with Google Cloud to bridge data movement and AI readiness. Or explore Incorta on Google Cloud Marketplace to get started.
During our latest webinar with Workday Adaptive Planning, we asked the audience a simple question: what data challenge is causing you the biggest headache right now? Fifty-five percent said the same thing. Their data lives in Excel or some other non-centralized source.
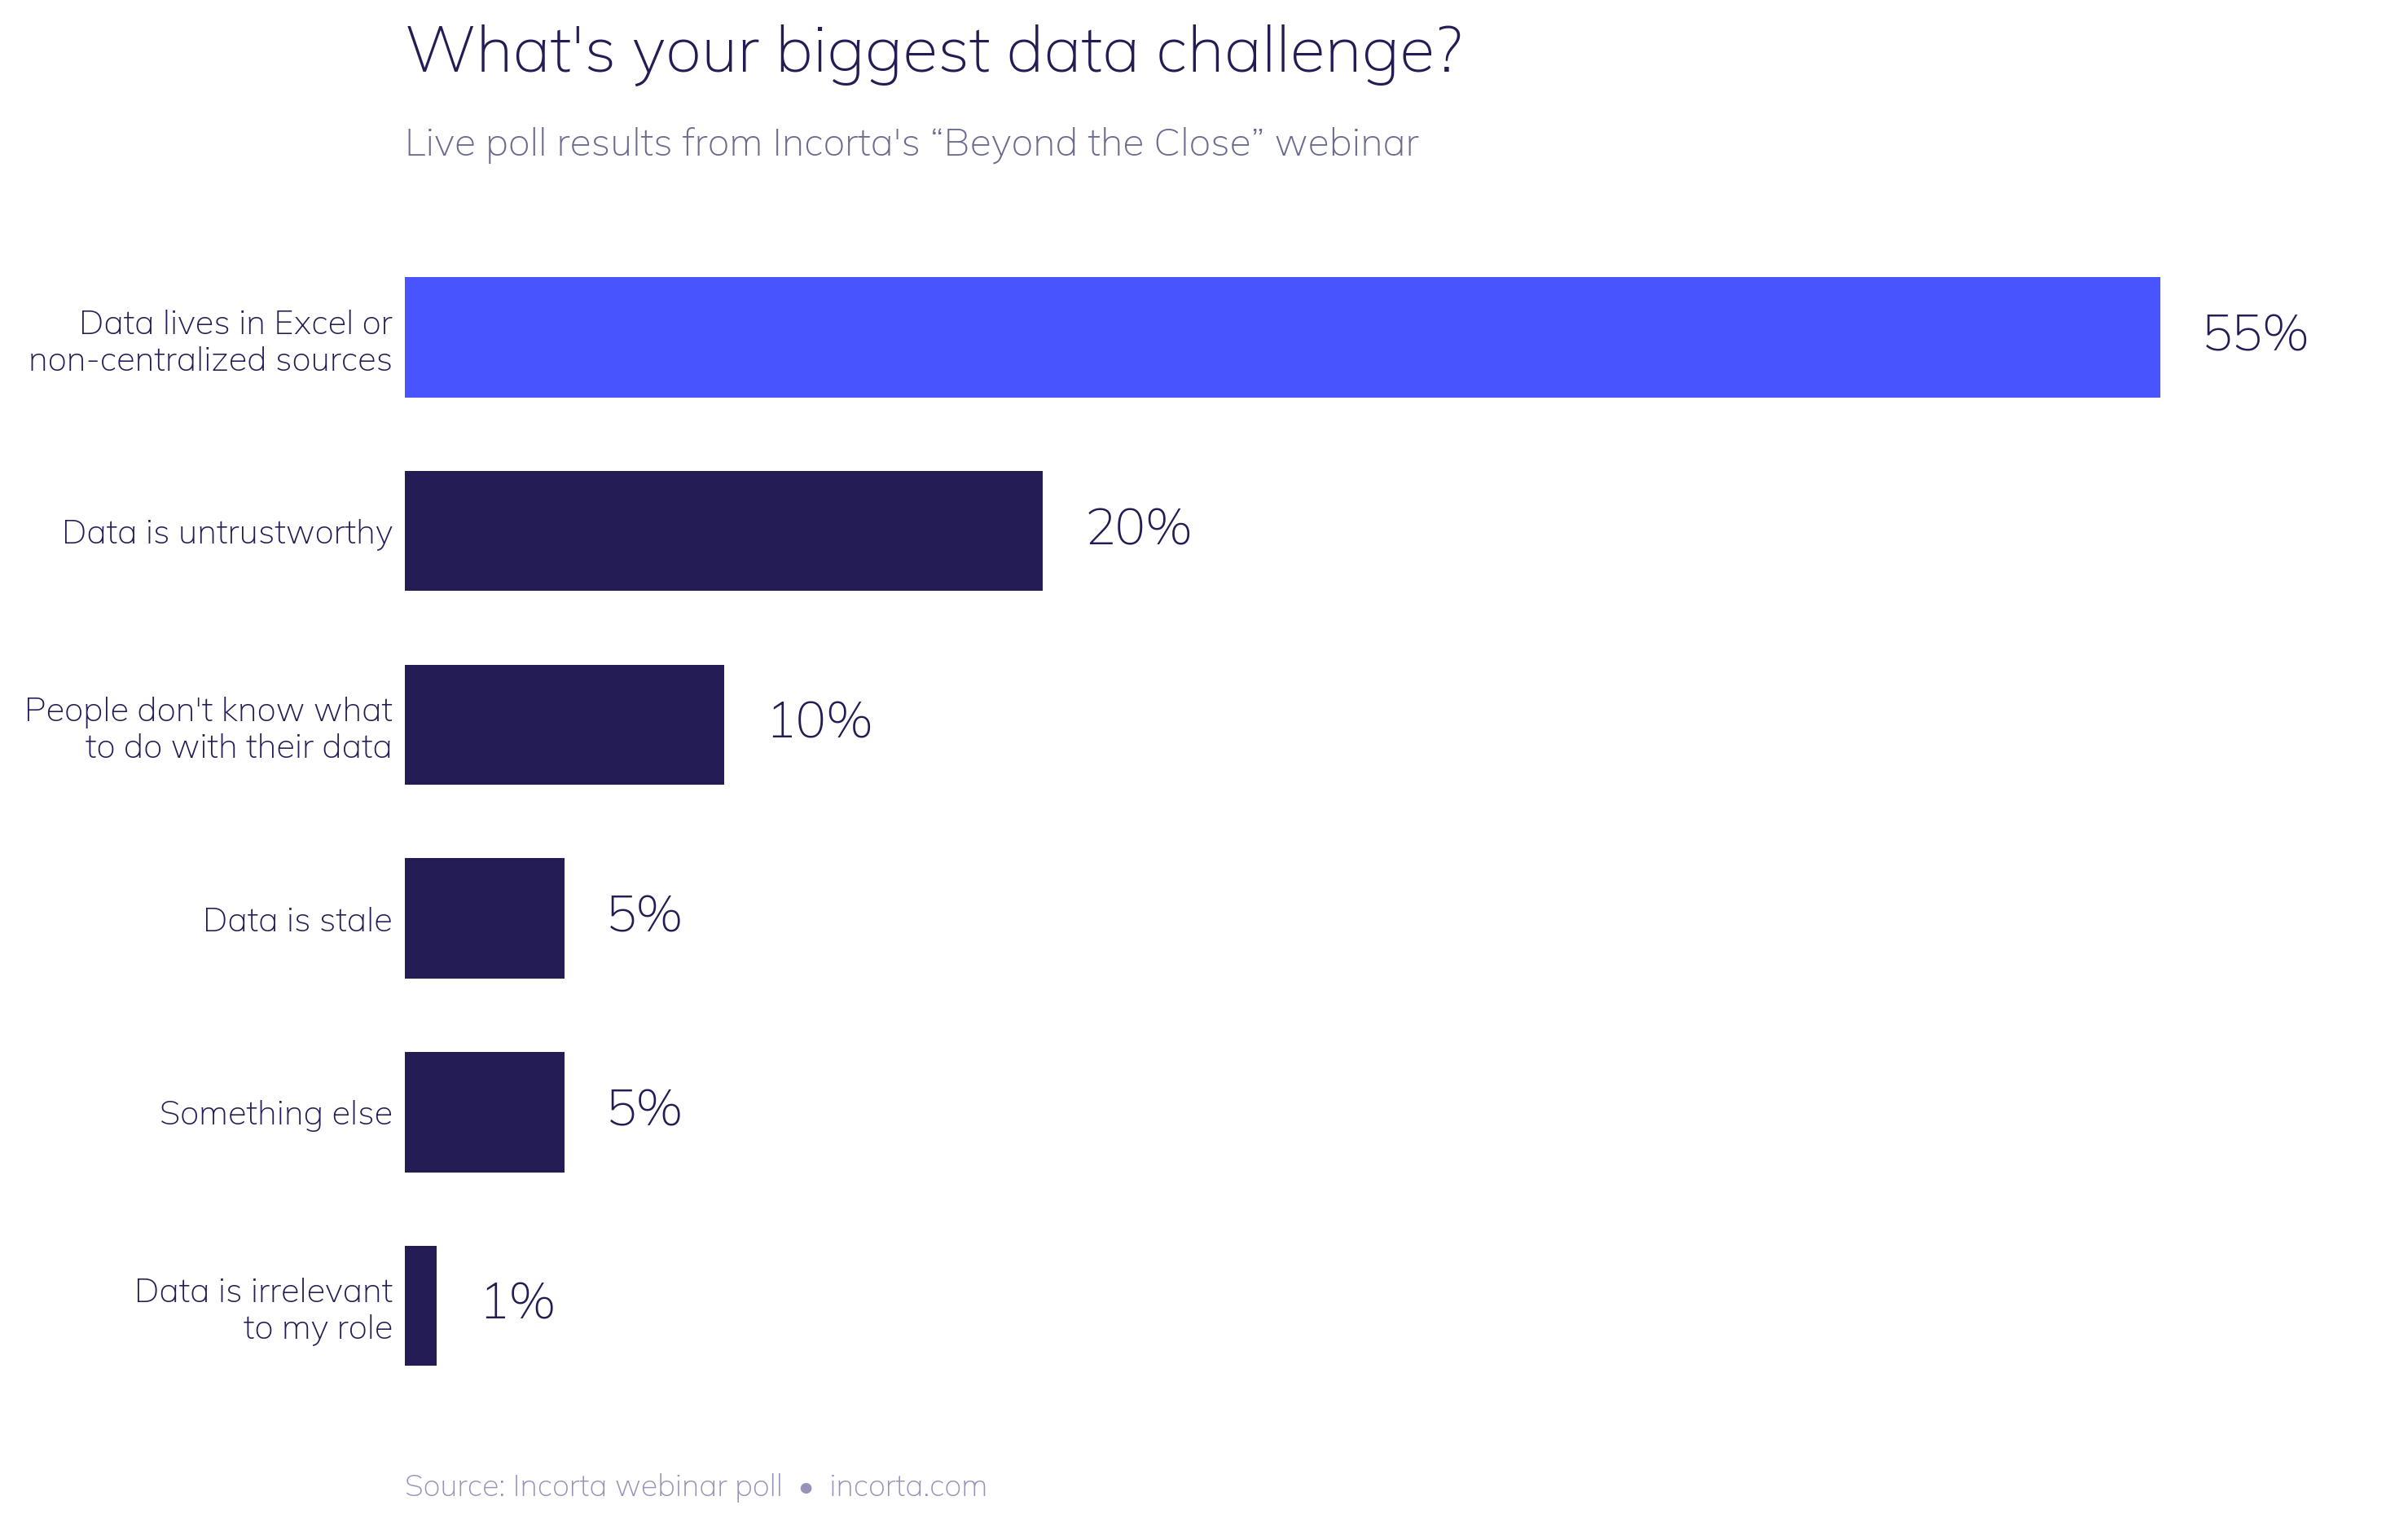
Nobody on the call was shocked. Ben Pierce, General Manager of Workday Adaptive Planning, walked through the pattern right after the results came in: a finance team needs a view their BI tool doesn't have, so they pull data out of the ERP, drop it into a spreadsheet, and spend the next several hours building VLOOKUPs and pivot tables just to get back to a starting point. Most of the effort goes into wrangling the data instead of actually analyzing it.
Analysts have been predicting Excel's decline for years. Gartner has forecast that by 2026, more than 70% of finance organizations will have moved off spreadsheets as their primary planning tool. But the Association for Finance Professionals' 2025 FP&A Benchmarking Survey tells a different story: 96% of finance practitioners still use spreadsheets weekly for planning, and 93% use them weekly for reporting, even at companies that already run a dedicated EPM platform.
Read those two data points side by side and the gap is hard to miss: trhe prediction and the reality aren't close.
And we get it! Excel is fast, familiar, and flexible in ways purpose-built systems often aren't. Nearly every finance professional already knows how to use it, so there's no training curve and no waiting on IT. When a forecast needs updating before a Monday meeting, Excel is usually the quickest way to get there.
The problem shows up later, once that spreadsheet becomes the system of record for a decision instead of a scratchpad for one.
A few things happen once Excel becomes the default workflow instead of a backup option.
Time disappears into data prep instead of analysis. The AFP numbers above aren't describing a minority workaround. They're describing how most finance teams spend most of their week, and it's rarely on the parts of the job that actually move the business forward.
Trust erodes. UK research from Sixthfin, covered by The Fintech Times, found that 67% of firms still run their financial close in Excel, and roughly a third of finance leaders admit they don't fully trust the reliability of their own close figures. When a number can't be traced back to its source with confidence, every conversation built on that number starts from a weaker position.
Errors compound quietly. Spreadsheets have no native audit trail. There's no built-in way to see who changed a formula, when, or why. A single broken link or copy-paste error can sit undetected for a full reporting cycle, and by the time it surfaces, it's already shaped a decision.
The close gets harder every month, not easier. Every one of those workarounds gets rebuilt from scratch next period. Nothing compounds in the team's favor. The same manual work just repeats.
Every attempt to force finance teams off spreadsheets by fiat runs into the same wall: Excel solves a real problem, and ripping it away without solving that problem first just pushes the workaround somewhere else.
The actual fix is giving finance direct, governed access to live operational data, so the spreadsheet stops being the only place that data can be shaped and explored. During the Incorta Builder launch webinar, this showed up directly in the forecast and planning app demo: users got an editable, grid-based planning interface that felt like Excel to work in, drag, fill, adjust assumptions, but every number underneath it was live, governed, and tied back to its source. Saving a plan wrote directly to the underlying database instead of creating another disconnected file that only one person understands.
That's the shift: not eliminating the spreadsheet experience finance teams are comfortable with, but connecting it to a foundation where the data is trustworthy, current, and traceable by default.
At Incorta's "Beyond the Close" webinar, 20% of attendees pointed to untrustworthy data as their biggest challenge, right behind the 55% stuck in Excel. Twenty percent might sound manageable next to a majority-vote problem. It isn't. It means a meaningful share of finance leaders are making decisions on numbers they don't fully believe, and saying so out loud in a room full of peers.
Mike Nader, Field CTO at Incorta, put the underlying issue plainly during the session: finance and accounting teams have to be able to communicate in a common way, and that starts with agreeing on what a number actually means. Without shared rules and shared context, two people can look at the same figure and mean two different things by it.
Data doesn't become untrustworthy on its own. It happens gradually, through a specific set of failures that show up in almost every finance function at some point.
Systems get connected by hand instead of through a governed pipeline, so every export is a fresh opportunity for something to drop or duplicate. Business rules live in someone's head, or in a spreadsheet formula nobody's touched in two years, instead of in a place the whole team can see and reference. There's no lineage, so when a number looks off, nobody can quickly trace it back to the transaction that produced it. And definitions drift. One team's "active customer" is another team's "customer with an order in the last 12 months," and nobody notices until the two reports don't match.
Any one of these is manageable. Stacked together, they're exactly why a fifth of a finance audience will say out loud that they don't trust their own numbers.
Cloudera's 2026 Data Readiness Index surveyed 1,270 IT leaders and found that while 85% believe they have a clear data strategy, only 18% consider their data fully governed. Informatica's CDO Insights 2026 study of 600 global data leaders found that 76% say their organization's AI governance can't keep pace with how employees are actually using AI day to day. And Grant Thornton's 2026 AI Impact Survey found that 78% of business executives lack confidence they could pass an independent AI governance audit within 90 days.
The same governance gap showing up in finance teams' Excel workflows is showing up across every function racing to adopt AI, and finance has more exposure than most, because nearly every decision in a company eventually shows up as a financial outcome.
Point an AI model at ungoverned, disconnected data and it won't hesitate the way a skeptical analyst would. It'll answer confidently, using whatever pattern it finds, whether or not that pattern reflects what's actually happening in the business. The output looks polished. The trust problem is just harder to see until something goes wrong.
Fixing this isn't about finding a smarter model. It's about giving finance a data foundation that's governed at the source, not cleaned up after the fact.
That means data landing exactly as it looks in the system of record, with no undocumented transformation on the way in. It means rules and business logic applied consistently, in a shared semantic layer instead of scattered across individual spreadsheets. It means every number staying traceable, so a finance user can walk from a summary figure back to the line-level transaction that produced it, in a few clicks, without filing a ticket. And it means that same foundation, and the same governance, applying whether a person is asking the question or an AI agent is.
That last point matters more every quarter. An agent answering a finance question needs to inherit the same row-level security and the same audit trail a human user would get from a dashboard. Otherwise, adding AI just adds a new, faster way to act on bad data.
Finance teams didn't lose trust in their data because they weren't paying attention. They lost it because the systems underneath weren't built to keep pace with how fast the business changes. Closing that gap takes a foundation that's governed from the moment data lands, not a faster way to query whatever's already there.
The latest updates and resources from us, directly to your inbox. (No spam, we promise!)