

I recently had the pleasure of speaking on the topic of “Unified Data and Analytics: The Key to Resiliency” at a webinar sponsored by Financial Information Management (FIMA). Resiliency is a hot topic in the age of COVID-19, so I thought it would be worth taking a closer look at what it actually means in terms of data and analytics.
Our initial understanding in this context is that resiliency is reactive. We’re seeing that data, and the insights that come from analytics are one of the keys to allowing companies to respond to demand in the face of the COVID crisis, or any crisis–a new market entrant; product innovation, or a risk that becomes a reality.
But true resiliency goes beyond simply responding. Our response should be one capable of creating a rebound, a bounce that takes you higher than you were before. In this sense, resiliency is also the creation of new potential.
For example, let’s say you are laid off from your job in an industry in which you’ve worked for 20 years. You could simply start looking for another similar job in the same industry. Instead, you take some training courses to modernize and broaden your skill set. Leveraging this new potential that you’ve created, you secure a higher level position in a new field in an up and coming industry. That is true resilience.
As it relates to data and analytics, it’s not just doing what we’ve always done–go set up a data warehouse or a data lake and start building some pipelines and study the problem so we can solve it. That’s the traditional reaction.
This is what we often see in a response to a product crisis. A competitor brings a new product to market, and you look at your manufacturing and supply chain data and figure out how to replicate that feature set. You even figure out how to do it at a lower cost. Perhaps your knockoff generates revenue, but you haven’t increased your potential. You’ve simply followed along. A reaction that is truly resilient takes your program to new heights, and that creates new potential.
There’s an equation that expresses the physics of potential energy of gravity. It is the formula for PE(g), Gravitational Potential Energy. It is:
PE(g)=m*g*h
where m =mass of the object in kilograms; g=acceleration of the object due to gravity, which is at a constant of 9.8 on earth; and h is the height of the object above ground measured in meters.
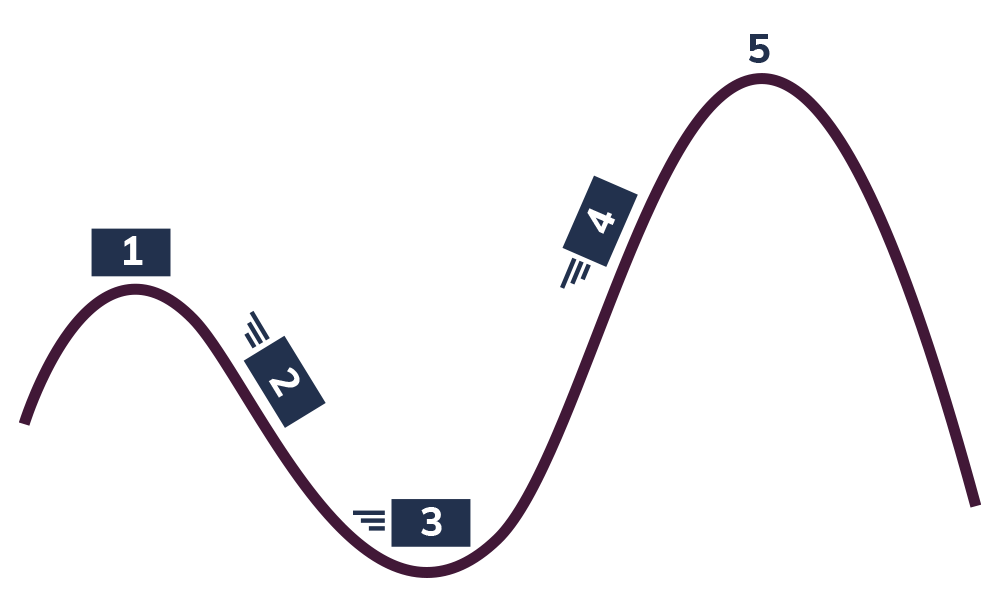
Think of a roller coaster where each time the car climbs higher, the potential energy is greater, and you can move up the next hill with less effort.
What I’m suggesting is that to build true resilience with regard to data and analytics, organizations need to make sure that the work they are doing to respond to the current crisis also generates the potential for their organization to take on more projects and solve more problems with less effort.
Applying the equation for potential energy (PEg) as an analogy for organizational resilience, we see that the key to doing this is increasing height.
Let’s say m= the mass of your organization (read: size), however you want to measure that (think revenue, mkt cap, etc), and g = the constant demand on the business for advanced data and analytics. Those multipliers grow organically, feeding on each other. As the business grows, so does the demand for data and analytics, and as our data and analytics capability grows, that feeds the growth of the business.
Height is the multiplier that can have the most impact. Since potential energy is directly related to height, if you’re two times more capable than a similarly sized competitor, you’ve got two times the potential. If you have half the mass of your closest competitor but have a greater height, you likely can innovate with data and analytics far faster.
So how do we define height in this equation?
I think it is the capability of your data and analytics program to do a few things. One, access and connect data from disparate sources. The more sources you can connect, and the faster you can do this, the better. Two, the ability to get that data to end-users as quickly as possible, and three, to allow them to leverage that for their own analytic work and apply their institutional and subject matter knowledge to it, and to formulate new questions and find answers in the data.
Now instead of a copy-cat response to your competitor’s new product, you can bring together data about your customers and their buying habits; about what’s happening in the market, and about the capability of your supply chain, and come up with a completely new product that catapults you ahead of the competition. This increase in potential, in the ability to quickly ask and answer many more questions, is what constitutes a resilient response.
How do you know if your data and analytics response to the current crisis is on the path to increasing height? Here are four questions to consider:
- Do you find that the gravitational pull of the business keeps creating data and analytics projects, but you never seem to get caught up? When you have a persistent backlog and the business is constantly changing, by the time you get to a project, it’s already stale and won’t deliver the same business value it would have in the moment. In fact, you might have four projects now as a result of not completing the initial project in a timely manner. There will always be this continual cycle of projects, and constant innovation within it as new insights are uncovered and new questions are raised. You should be able to take on that work and complete projects very, very quickly.
- How is the return on your overall technical investment, both from your systems of record and the platforms that are enabling your data analytics? Is it diminishing? Is there a continuing need to bring in more resources and new components to execute your existing data and analytics strategy?
- How satisfied are your end-users? To get at this, you may need to conduct an internal survey. If you just look at your project completion in a vacuum, you would only be looking at the users who are engaged with you. You might have users so disillusioned that they’re just not even bringing new projects to you anymore. They may just be doing their own projects.
- Are you able to give people access to data and the freedom to explore it with the confidence that you have the right security and controls in place to prevent breaches and misuse?
If you’re not getting the bounce that you think you should be; if your data and analytics program feels more like a Sisyphisean effort to continually push a rock up a hill, consider how you can improve in these four areas.
The more nimble you can be at delivering data and analytics, the more data-driven you’ll be as an organization. Data and analytics can generate their own energy because they endlessly create and satisfy curiosity, and curiosity is what drives a better understanding of the market, the product, and ultimately the customer.
And I think that’s what resilience really is: A direct link to curiosity. It’s not just reacting to the current crisis. It’s building your ability to adapt, innovate, and analyze data across the organization and increase the potential energy of your data and analytics program. It’s building capacity to ask new questions, take on new problems, and solve them in ways that drive the organization forward.